
Beschreibung
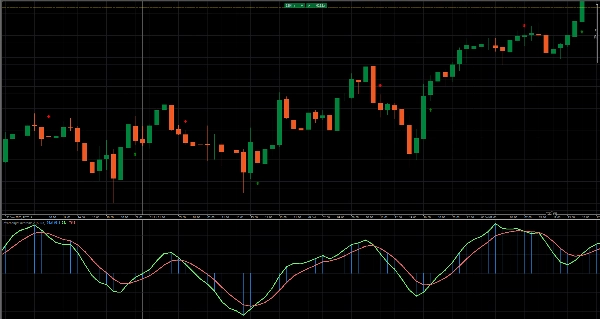
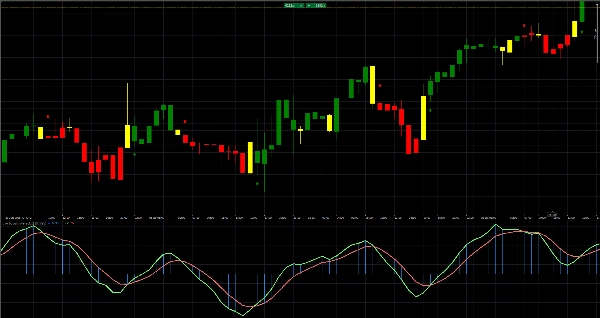
✅ Erkennt überkaufte & überverkaufte Zustände mit normalisiertem Momentum
✅ Verwendet einen geglätteten EMA-basierten Zentralpreis für stabile Signalgenerierung
✅ Zeigt doppelte Histogramme (Oo & Ll) zur Visualisierung des Momentumdrucks
✅ Farblich codierte Balken zeigen sofort bullische, bärische oder unentschlossene Phasen
✅ Markiert präzise KAUF- & VERKAUFSPUNKTE mit strengen Kreuzungspfeilen
Verbessern Sie Ihr Timing mit dem Überkauft / Überverkauft Indikator: Er berechnet einen geglätteten Zentralpreis (ys1) mittels EMA, normalisiert das Momentum durch Standardabweichung und stellt doppelte Histogramme (Oo & Ll) neben Auf-/Abwärts-EMA-Linien dar. Farblich codierte Balken heben sofort bullische (grün), bärische (rot) oder unentschlossene (gelb) Momentumwechsel hervor, während strenge Kreuzungspfeile präzise Kauf- und Verkaufspunkte markieren. Fügen Sie dieses Overlay Ihrem Chart hinzu für kristallklare Überkauft/Überverkauft-Signale und timen Sie Ihre Ein- und Ausstiege mit Zuversicht!
Auch verfügbar als CBOT overbought oversold cbot cBot - cTrader Store
Zusammenfassung
Kundenbewertungen
5 | 100 % | |
4 | 0 % | |
3 | 0 % | |
2 | 0 % | |
1 | 0 % |


