Beschreibung
WICK COMMANDER — Wissen Sie genau, wann der Markt sich verpflichtet
Die meisten Trader beobachten Kerzen. Wick Commander beobachtet Absicht.
Jede Kerze erzählt eine Geschichte – aber es ist der Schlusskurs, der die Wahrheit offenbart. Wick Commander verfolgt das Hoch und Tief der vorherigen Kerze und wartet darauf, dass der Preis über diesen Bereich mit Überzeugung schließt. Keine Docht-Fakes. Kein Rauschen. Nur bestätigte Ausbrüche, die durch einen vollständigen Kerzenschluss gestützt werden.
WIE ES FUNKTIONIERT
Die Logik ist messerscharf:
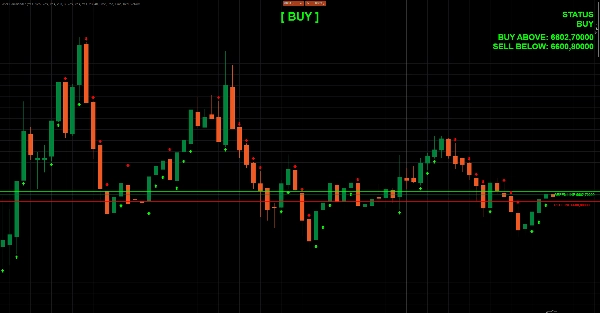
Ein KAUF-Signal wird ausgelöst, wenn eine bullische Kerze über dem Hoch der vorherigen Kerze schließt – der Preis hat nicht nur kurz durchgestochen, er hat sich verpflichtet. Ein VERKAUF-Signal wird ausgelöst, wenn eine bärische Kerze unter dem Tief der vorherigen Kerze schließt – die Verkäufer haben die volle Kontrolle übernommen.
Zwei dynamische Linien aktualisieren sich in Echtzeit auf Ihrem Chart. Die grüne Linie markiert das Ausbruchsniveau nach oben. Die rote Linie markiert das Abbruchniveau nach unten. Wenn der Preis jenseits einer der Linien mit der richtigen Kerzenrichtung schließt, erscheint der Pfeil und das Dashboard aktualisiert sich sofort.
WAS SIE IM CHART SEHEN
- 🟢 Grüne Linie — live Kauf-Schwelle (Hoch der vorherigen Kerze)
- 🔴 Rote Linie — live Verkaufs-Schwelle (Tief der vorherigen Kerze)
- ⬆️ Kauf-Pfeile — unter der Signal-Kerze bei bestätigten bullischen Ausbrüchen gedruckt
- ⬇️ Verkaufs-Pfeile — über der Signal-Kerze bei bestätigten bärischen Abbrüchen gedruckt
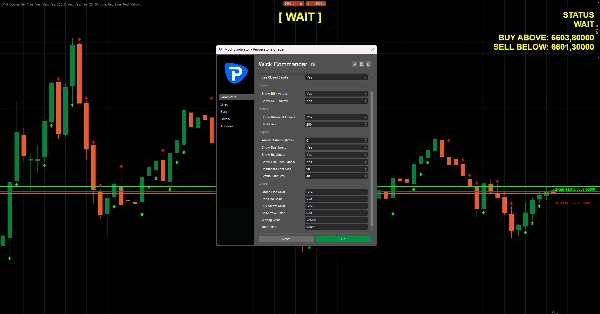
- 📊 Dashboard-Panel — zeigt aktuellen Status (KAUF / VERKAUF / WARTEN), genaue Auslöserpreise und aktualisiert sich bei jedem Balken
- 🔵 Große Statusanzeige — großes zentriertes Label, das die aktuelle Marktrichtung auf einen Blick zeigt
- 🕓 Vollständiger historischer Scan — blickt bis zu 5000 Balken zurück, damit Sie die Signalqualität auf Ihrem Instrument und Zeitrahmen sofort validieren können
EIGENSCHAFTEN
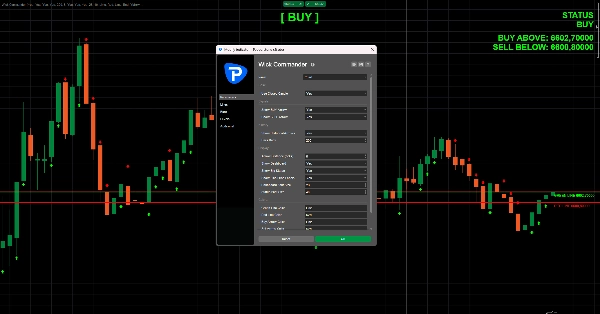
- Funktioniert auf jedem Zeitrahmen und jedem Instrument
- Wechsel zwischen Bestätigung durch geschlossene Kerze und Live-Kerzen-Modus
- Volle Kontrolle über Pfeilabstand, Farben, Schriftgrößen und Anzeigeelemente
- Historische Signalüberlagerung für sofortiges Backtesting im Chart
- Saubere, nicht nachzeichnende Logik — Signale basieren nur auf geschlossenen Kerzen (wenn der Bestätigungsmodus aktiviert ist)
- Keine externen Daten, kein Internet erforderlich —
AccessRights.None, vollständig Store-kompatibel
FÜR WEN IST DAS?
Ausbruch-Trader, Momentum-Trader und alle, die genug von falschen Docht-Ausbrüchen haben. Wenn Sie ein sauberes, regelbasiertes Signal wollen, das nur feuert, wenn die Kerze tatsächlich schließt über dem vorherigen Bereich – Wick Commander ist Ihr Werkzeug.
Einfache Regeln. Saubere Visualisierung. Kein Zweifeln.
Übernehmen Sie die Kontrolle über den Docht.
Zusammenfassung
Key features include:
- Real-time dynamic lines on the chart: a green line marking the previous candle’s high (buy threshold) and a red line marking the previous candle’s low (sell threshold).
- Buy signals trigger when a bullish candle closes above the previous high; sell signals trigger when a bearish candle closes below the previous low.
- Visual cues include arrows indicating buy or sell signals and a dashboard panel displaying current market status (BUY, SELL, WAIT) with exact trigger prices.
- A large status display provides an at-a-glance market bias.
- Historical signal overlay allows backtesting up to 5000 bars.
- Customizable display options for arrow distance, colors, and fonts.
- Operates on any timeframe and instrument without external data or internet connection.
- Supports toggle between closed-candle confirmation and live-candle mode with zero repaint logic when confirmation mode is enabled.
Wick Commander is suited for breakout and momentum traders seeking clear, rules-based signals based on candle close confirmations across markets including forex, indices, commodities, stocks, and cryptocurrencies.