
Beschreibung
Die beste Art, den Composite Index im Zusammenhang mit dem RSI zu betrachten, ist, den RSI als Windows 3.0 und den Composite Index als Windows 10 zu sehen. Constance Brown entdeckte, dass der RSI, obwohl er Divergenzen erzeugt und erkennt, nicht so genau ist, wie er sein könnte. Es ist ein bisschen ein Oxymoron, dies zu sagen, aber der RSI ist ein Momentum-Indikator ohne eine daran angehängte Momentum-Berechnung. Der RSI verpasst eine beträchtliche Anzahl wichtiger Bewegungen und erzeugt sogar einige schlechte Bewegungen. Was Constance Brown mit dem RSI gemacht hat, war, eine Momentum-Berechnung innerhalb des RSI selbst einzufügen. Dieser Index entfernt die Normalisierungsbereichsbeschränkungen im RSI. Das bedeutet, dass er nicht an den Bereich von 0-100 gebunden ist.
Der RSI und der Composite Index zusammen
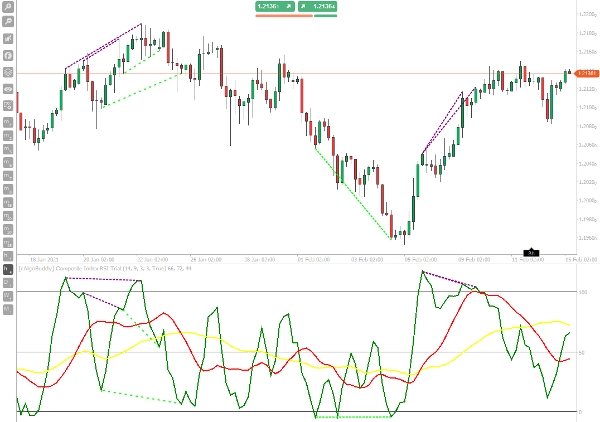
Eine der Strategien, die Constance Brown mit dem Composite Index anwandte, war, den Composite Index mit dem RSI zu vergleichen. Wenn wir nach Divergenzen suchen, suchen wir nach Dingen wie bullischer Divergenz. Eine bullische Divergenz tritt auf, wenn der Preis höhere Hochs erzeugt, der Oszillator jedoch niedrigere Hochs zeigt. Wenn wir den RSI und den Composite Index zusammen verwenden, behandeln wir den RSI wie ein Kursdiagramm und der Composite Index ist der Oszillator.
Der Indikator hat eine interne normale RSI-Linie, um Divergenzen zu erkennen, sodass die Arbeit für Sie erledigt wurde. Handeln Sie die Divergenzsignale wie bei jedem anderen Oszillator.
Das Hauptmerkmal des Composite Index ist es, das Momentum mit klaren Betriebssignalen darzustellen. Wenn also der RSI eine überkaufte oder überverkaufte Zone betritt, stellt das Kreuzen des Composite Index mit seinen gleitenden Durchschnitten in die entgegengesetzte Richtung ein gutes Handelssignal dar. Wenn man dann diese Symbiose des Oszillatormomentums mit der Kursaktion an Unterstützungen und Widerständen einrahmt, erhält man eine sehr interessante und gewinnende Handelslogik, die auch gut für den Handel mit Kryptowährungen geeignet ist.
Anwendung
Die Composite Index Strategie ist eine Momentum-Preisaktionsstrategie, die auf einer Kombination von Unterstützungs- und Widerstandsniveaus mit den überkauften und überverkauften Niveaus des Relative Strength Index und des Composite Index basiert. Der Composite Index ist in dieser Handelsstrategie auch das endgültige Timing für den Einstieg.
Zeitrahmen: H1+, immer zusammen mit RSI verwenden.
Kaufen
- Der Preis prallt an der Unterstützung ab.
- Die gleitenden Durchschnitte des Composite RSI liegen unter dem Niveau 50 und der schnelle GD (Rot) ist unter dem langsamen GD (Gelb).
- Der RSI bildet ein Tief und der Wert liegt nahe oder unter 30, und auch der Composite Index hat ein Tief.
- Wir gehen long in dem Moment, in dem der Composite Index die gleitenden Durchschnitte nach oben kreuzt.
Verkaufen
- Der Preis prallt am Widerstand ab.
- Die gleitenden Durchschnitte des Composite liegen über dem Niveau 50 und der schnelle GD (Rot) ist über dem langsamen GD (Gelb)
- Der RSI hat einen Gipfel und der Wert liegt nahe oder über 70, und auch der Composite Index hat einen Gipfel.
- Wir gehen short, wenn der Composite Index die gleitenden Durchschnitte nach unten kreuzt (dies ist das Timing für den Markteintritt).
Zusammenfassung
Kundenbewertungen
5 | 0 % | |
4 | 100 % | |
3 | 0 % | |
2 | 0 % | |
1 | 0 % |


