
Beschreibung
Einführung in ADX
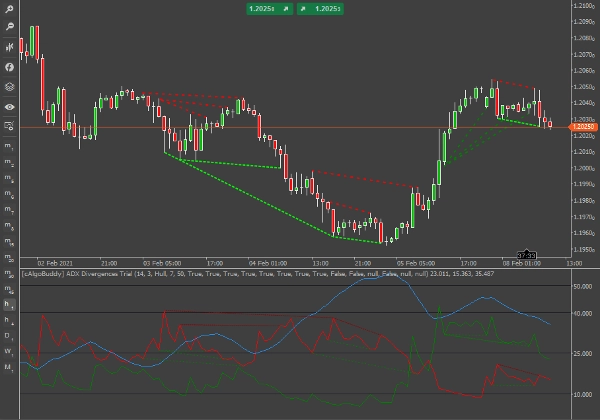
ADX (blaue Linie) wird als einzelne Linie mit Werten von null bis hundert dargestellt. ADX ist nicht-richtungsgebunden; er misst die Trendstärke, unabhängig davon, ob der Preis steigt oder fällt. Der Indikator wird üblicherweise im selben Fenster wie die beiden Linien des Directional Movement Indicators (Di+ und Di-) dargestellt, von denen ADX abgeleitet wird.
Dieser Indikator erkennt Divergenzen auf den Di+ und Di- Linien. Im Gegensatz zu anderen Indikatoren, die Divergenzen erkennen, können wir mit diesem mehr wertvolle Informationen aus den beiden anderen Gegenstücken eines Divergenzsignals gewinnen. Zum Beispiel, wenn eine Divergenz auf Di+ auftritt, können wir das Signal unter Berücksichtigung der Di- und ADX Werte bewerten.
Die Di+ und Di- Linien sind teilweise mit einem Hull Moving Average über 3 Perioden geglättet. Für eine 100% Divergenzflut können Sie die MA-Periode auf 1 und den gleitenden Durchschnittstyp auf Einfach setzen. Da wir jedoch Divergenzen auf 2 Linien im selben Indikatorfenster zeichnen, kann es manchmal überwältigend sein, alle Signale zu sehen. Andererseits können Sie in den Indikatoreinstellungen genau auswählen, welche Arten von Divergenzen Sie sehen möchten und für welche Linie (Di+ oder Di-).
Ein Divergenzsignal gilt als bestätigt bei der Eröffnung der Kerze nach einer Divergenz. Aufgrund der „unflexiblen“ Natur der ADX-Trendlinien (im Vergleich zum Beispiel zum RSI) bleibt eine Divergenzlinie wahrscheinlich bis zur Bestätigungskerze bestehen, sofern keine extreme Volatilität auftritt.
Bevor Sie ein Divergenzsignal handeln, identifizieren Sie Folgendes:
- Richtung und Niveau des ADX
- Abstand zwischen Di+ und Di-
- Richtung und Niveau von Di+
- Richtung und Niveau von Di-
Beachten Sie außerdem
- Vermeiden Sie es, Divergenz-Trades einzugehen, wenn der ADX niedrig ist (unter 15 und fallender Trend), da Signale auf bereits entwickelten oder sich entwickelnden Trends basieren sollten.
- Beachten Sie auch, dass das Kreuzen von Di+ und Di- an sich ein bullishes/bearishes Signal ist, passen Sie Ihre Positionen entsprechend an.
- Falls sowohl Di+ als auch Di- auf derselben Kerze divergieren, wählen Sie die passendere Linie je nach Trend (bullisher Trend/bullishes Signal Di+, bearisher Trend/bearishes Signal Di-).
- Sie müssen nicht jedes Signal handeln.
Divergenzen auf DiPlus
DiPlus (Grün) ist die Linie, die die Stärke des Aufwärtstrends darstellt. Wir können Divergenzen zwischen der Stärke des Aufwärtstrends ähnlich wie bei den meisten Oszillatoren erkennen.
Reguläre bullishe Divergenz
Definition: Der Preis machte ein tieferes Tief, aber der Indikator ein höheres Tief. Das ideale Ergebnis ist: Nach einem kleinen bullischen Anstieg sollte sich ein bärischer Trend entwickeln. Gezeichnet mit einer gepunkteten hellgrünen Linie im Preis- und Indikatorfenster.
Ein dominanter bärischer Trend, der sich zu entwickeln beginnt oder bereits entwickelt ist. Wir gehen short, nachdem die kleine Korrektur stattgefunden hat. In einigen Fällen kann die Divergenz auf Di+ auf einer bärischen Kerze auftreten, was eine gute Bestätigung des dominanten bärischen Trends ist.
Gelegentlich entwickelt der bullische Anstieg einen bullischen Trend. Dies kann passieren, wenn wenig bis kein Trend vorhanden ist (Di+ und Di- liegen nah beieinander, ADX< 20) oder nach Erschöpfung des bärischen Trends an Widerstandsniveaus.
Versteckte bullishe Divergenz
Definition: Der Preis machte ein höheres Tief und der Indikator ein tieferes Tief. Wir sollten eine Entwicklung oder Fortsetzung des bullischen Trends erwarten. Gezeichnet mit einer teilweise gepunkteten dunkelgrünen Linie im Preis- und Indikatorfenster.
Ein dominanter bullischer Trend, der sich zu entwickeln beginnt oder bereits entwickelt ist. Wir gehen long, nachdem die kleine Korrektur stattgefunden hat. Der Stop-Loss sollte um das Tief der Divergenzkerze gesetzt werden.
Eines der besseren Signale dieses Indikators, hauptsächlich weil wir eine sofortige Trendfortsetzung erwarten und unsere Stop-Losses minimal halten können.
Reguläre bärische Divergenz
Definition: Der Preis machte ein höheres Hoch, aber der Indikator ein niedrigeres Hoch. Nach einem kleinen bärischen Rückgang sollten wir eine Entwicklung eines bullischen Trends sehen. Gezeichnet mit einer gepunkteten dunkelroten Linie im Preis- und Indikatorfenster.
Ein dominanter bullischer Trend ist weiterhin im Aufstieg (ADX steigt noch zur Divergenzzeit).
Die Umstände für dieses Szenario sind sehr selten, da Di+ die bullishe Stärke repräsentiert. Üblicherweise treten diese Umstände nach Erschöpfung des bullischen Trends auf, was bedeutet, dass es der letzte „Gipfel“ ist, bevor sich der bärische Trend entwickelt. Daher wird meistens empfohlen, bei diesem Signal short zu gehen.
Versteckte bärische Divergenz
Definition: Der Preis machte ein niedrigeres Hoch und der Indikator ein höheres Hoch. Wir sollten eine Fortsetzung des bärischen Trends erwarten. Gezeichnet mit einer teilweise gepunkteten roten Linie im Preis- und Indikatorfenster.
Ein dominanter bärischer Trend mit bullischen Ausschlägen (ADX steigt noch zur Divergenzzeit).
Eine Fortsetzung des bärischen Trends von der bullischen Trendlinie zu erwarten, ist kontraintuitiv, weshalb dieses Signal mit großer Vorsicht genommen werden sollte. Oft tritt nach dieser Divergenz eine Konsolidierungsphase ein.
In einem trendlosen Markt vermeiden Sie es, einen Trade einzugehen. In einem erschöpften bärischen Trend, wenn Sie short gehen, scalpen Sie den Trade.
Divergenzen auf DiMinus
DiMinus (Rot) ist die Linie, die die Stärke des Abwärtstrends darstellt. Die Art, wie wir Divergenzen zwischen Preis und DiMinus erkennen, ist gewissermaßen das Gegenteil der Methode bei DiPlus.
Reguläre bullishe Divergenz
Definition: Der Preis machte ein tieferes Tief, aber der Indikator ein niedrigeres Hoch (statt eines höheren Tiefs). Nach einem kleinen bullischen Anstieg sollte sich ein bärischer Trend entwickeln. Gezeichnet mit einer gepunkteten hellgrünen Linie im Preisfenster und einer gepunkteten dunkelroten Linie im Indikatorfenster.
Ein dominanter bärischer Trend, der sich zu entwickeln beginnt oder bereits entwickelt ist. Wir gehen short, nachdem die kleine Korrektur stattgefunden hat. In einigen Fällen kann die Divergenz auf Di- auf einer bärischen Kerze auftreten, was eine gute Bestätigung des dominanten bärischen Trends ist.
Wie beim Signal vom Di+ Gegenstück wird manchmal der bärische Anstieg einen bärischen Trend entwickeln. Dies kann passieren, wenn wenig bis kein Trend vorhanden ist (Di+ und Di- liegen nah beieinander, ADX< 20) oder nach Erschöpfung des bullischen Trends an Widerstandsniveaus.
Versteckte bullishe Divergenz
Definition: Der Preis machte ein höheres Tief und der Indikator ein höheres Hoch (statt eines tieferen Tiefs). Wir sollten eine Fortsetzung des bullischen Trends erwarten. Gezeichnet mit einer teilweise gepunkteten grünen Linie im Preisfenster und einer teilweise gepunkteten dunkelroten Linie im Indikatorfenster.
Es ist kontraintuitiv, eine Fortsetzung des bullischen Trends von der Di- Trendlinie zu erwarten. Wir benötigen bärische Ausschläge in einem bullischen Trend.
Reguläre bärische Divergenz
Definition: Der Preis machte ein höheres Hoch, aber der Indikator ein höheres Tief (statt eines niedrigeren Hochs). Nach einem bärischen Rückgang im Preis sollte eine bullische Trendfortsetzung folgen. Gezeichnet mit einer gepunkteten dunkelroten Linie im Preisfenster und einer gepunkteten hellgrünen Linie im Indikatorfenster.
Es wird empfohlen, in einem starken und sich entwickelnden bullischen Trend long zu gehen. In einem erschöpften und verbrauchten bullischen Markt hingegen short zu gehen.
Versteckte bärische Divergenz
Der Preis machte ein niedrigeres Hoch und der Indikator ein niedrigeres Tief (statt eines höheren Hochs). Wir sollten eine Fortsetzung des bärischen Trends erwarten. Gezeichnet mit einer teilweise gepunkteten roten Linie im Preisfenster und einer teilweise gepunkteten grünen Linie im Indikatorfenster.
Eines der besseren Signale dieses Indikators, hauptsächlich weil wir eine sofortige Fortsetzung des bärischen Trends erwarten und unsere Stop-Losses minimal halten können. Der Stop-Loss sollte am Tief der Divergenzkerze gesetzt werden.
Sofortige Telegram-Nachrichtenbenachrichtigungen
Vorausgesetzt, Sie haben einen Bot und einen Kanal in Telegram eingerichtet, sendet der ADX Divergences Indikator Ihnen Nachrichten für bestätigte Signale auf dem Währungspaar, auf dem Sie ihn ausführen. Beachten Sie, dass Sie nur Signale für die Paare erhalten, für die Sie „Ja“ zur Anzeige ausgewählt haben. Sie können diesen Trading-Roboter so konfigurieren, dass er auch sofortige Telegram-Benachrichtigungen direkt an Ihren PC, Tablet oder Ihr Mobiltelefon sendet.
WICHTIG: Bitte stellen Sie sicher, dass Ihre Zeitzone korrekt auf Ihre Ortszeit eingestellt ist (unten rechts in der Anwendung).
Desktop-Benachrichtigungen
Wenn Sie „Ja“ auswählen, zeigt der ADX Divergences Indikator bei bestätigten Signalen eine Nachrichtenbox-Benachrichtigung auf Ihrem persönlichen Desktop an.
E-Mail-Benachrichtigungen
Damit diese Funktionalität funktioniert, müssen Sie zuerst Ihren cTrader so konfigurieren, dass er E-Mails senden kann (Einstellungen-> E-Mail). Wenn Sie „Ja“ auswählen, sendet der ADX Divergences Indikator eine E-Mail bei bestätigten Signalen an die von Ihnen eingegebene Adresse.
Zusammenfassung
This indicator detects divergences on both Di+ and Di- lines, allowing traders to analyze signals with additional context from the other directional lines and ADX levels. The Di+ and Di- lines are smoothed using a Hull moving average, adjustable via settings to control signal sensitivity and display preferences.
Divergence signals are confirmed at the opening of the bar following the divergence, with guidance provided on interpreting various divergence types—regular and hidden bullish and bearish divergences—on both Di+ and Di- lines. Users are advised to consider ADX levels, the distance between Di+ and Di-, and the direction and level of each line before trading signals.
The indicator supports instant alerts via Telegram messages, desktop notifications, and email, configurable within the platform. Proper time zone settings are required for accurate alert timing. This tool is applicable across multiple markets including Forex, commodities, indices, stocks, and cryptocurrencies such as BTCUSD and XAUUSD.
Kundenbewertungen
5 | 100 % | |
4 | 0 % | |
3 | 0 % | |
2 | 0 % | |
1 | 0 % |


