
Beschreibung
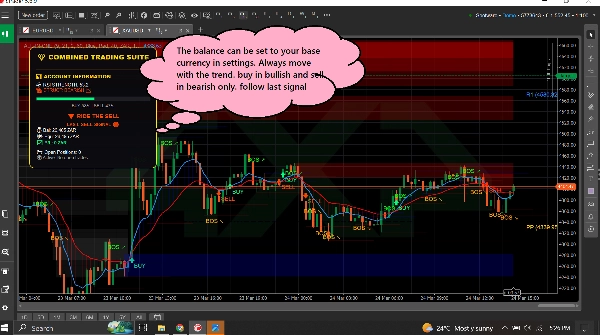
| ALL IN ONE TRADING PRO|
## Was ist dieser Indikator?
Dieser Indikator legt **drei hilfreiche Trading-Tools** gleichzeitig auf dein Chart. Stell es dir vor wie drei erfahrene Trader, die dir gleichzeitig ihre Meinung geben.
=====================================================
## Die drei Werkzeuge
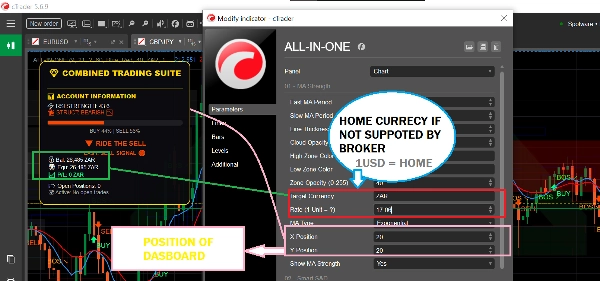
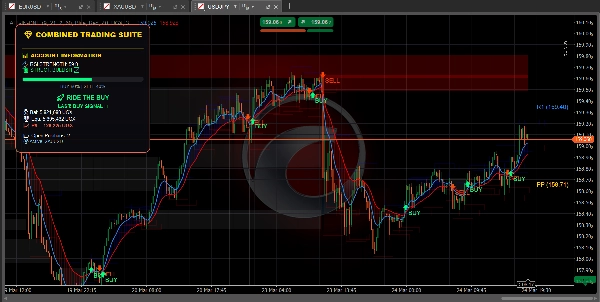
### 1. TREND DASHBOARD (Der Trend-Tracker)
**Was es macht:** Zeigt dir, in welche Richtung sich der Markt bewegt und wie stark die Bewegung ist.
**Was du siehst:**
- **Blaue Linie** = Schneller gleitender Durchschnitt (Kurzfristtrend)
- **Rote Linie** = Langsamer gleitender Durchschnitt (Langfristtrend)
- **Blauer Wolke** = Aufwärtstrend (Preis steigt)
- **Rote Wolke** = Abwärtstrend (Preis fällt)
- **Grüner Pfeil** = KAUF-Signal erscheint
- **Roter Pfeil** = VERKAUF-Signal erscheint
- **RSI-Balken** = Zeigt an, ob der Markt überkauft (zu hoch) oder überverkauft (zu niedrig) ist
========================================================
**Zeigt auch:**
- Dein Kontostand und Gewinn/Verlust
- Wie viele Positionen du offen hast
- Einfache Textempfehlungen wie "SICHER ZU KAUFEN" oder "KAUFEN WEITERFÜHREN"
============================================================
### 2. ANGEBOTS- & NACHFRAGEZONEN (Der Schlüssel-Level-Finder)
**Was es macht:** Findet wichtige Preisniveaus, an denen sich der Markt umkehren oder pausieren könnte.
**Was du siehst:**
- **Blaue Kästen** = Nachfragezonen (Bereiche, in denen Käufer aktiv werden - GUT zum Kaufen)
- **Rote Kästen** = Angebotszonen (Bereiche, in denen Verkäufer aktiv werden - GUT zum Verkaufen)
- **Graue Kästen** = Getestete Zonen (weniger zuverlässig)
============================================================
**Wie man es benutzt:**
- Preis fällt auf einen blauen Kasten zu? Schau nach KAUFEN
- Preis steigt auf einen roten Kasten zu? Schau nach VERKAUFEN
- Frische (helle) Kästen funktionieren besser als graue
============================================================
**Zeigt auch:**
- **BOS ↗** = Markt hat nach oben durchbrochen, Trend könnte weiter steigen
- **BOS ↘** = Markt hat nach unten durchbrochen, Trend könnte weiter fallen
============================================================
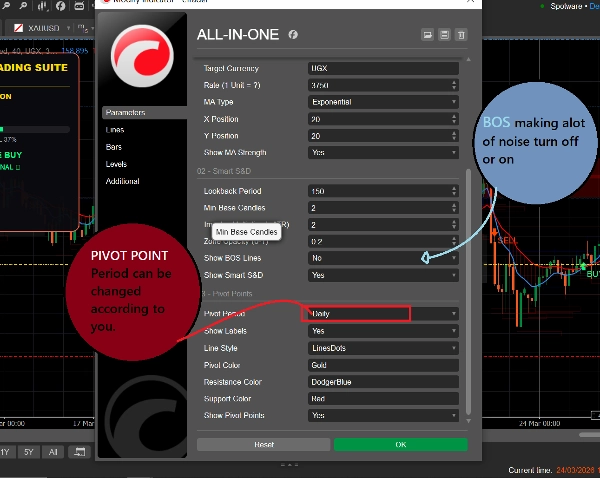
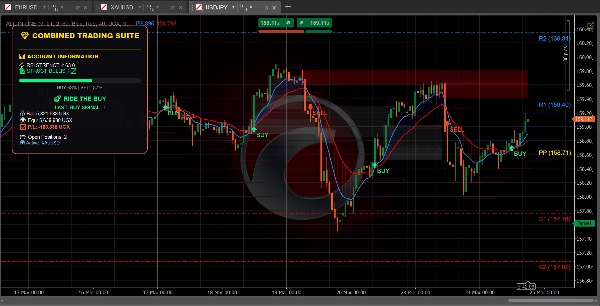
### 3. PIVOT-PUNKTE (Die Unterstützungs- & Widerstandsniveaus)
**Was es macht:** Berechnet automatische Preisniveaus, an denen der Markt oft stoppt oder sich dreht.
**Was du siehst:**
- **Goldene Linie** = Pivot-Punkt (Zentralniveau)
- **Blaue Linien** = Widerstandsniveaus (Preis könnte hier fallen)
- **Rote Linien** = Unterstützungsniveaus (Preis könnte hier steigen)
============================================================
**Du kannst wählen:**
- **Täglich** = Niveaus ändern sich einmal pro Tag
- **Wöchentlich** = Niveaus ändern sich einmal pro Woche
- **Monatlich** = Niveaus ändern sich einmal pro Monat
- **15-Minuten** = Niveaus ändern sich alle 15 Minuten (gut für schnelles Trading)
============================================================
## Wie man es benutzt (Einfach)
### Um einen KAUF-Trade zu finden:
1. Warte, bis der Preis eine **blaue Nachfragebox** erreicht
2. Prüfe, ob die blaue MA-Linie über der roten MA-Linie liegt (Aufwärtstrend)
3. Die Signale sollten nur befolgt werden, wenn der Markt im richtigen Trend ist
============================================================
### Um einen VERKAUF-Trade zu finden:
1. Warte, bis der Preis eine **rote Angebotsbox** erreicht
2. Prüfe, ob die rote MA-Linie über der blauen MA-Linie liegt (Abwärtstrend)
3. Die Signale sollten nur befolgt werden, wenn der Markt im richtigen Trend ist
============================================================
### Um schnelle Trades zu finden:
1. Verwende 15-Minuten-Pivot-Punkte für präzise Niveaus
2. Achte auf BOS-Pfeile für die Trendrichtung
3. Prüfe das Dashboard auf Marktstärke
4. Nimm Trades, die zur Richtung passen
============================================================
## Was alle Farben bedeuten
| Farbe | Bedeutung |
| 🟦 Blau | Bullisch / Kaufsignale / Nachfragezonen / Widerstandspivots |
| 🔴 Rot | Bärisch / Verkaufssignale / Angebotszonen / Unterstützungspivots |
| 🟨 Gold | Pivot-Punkt (Zentralniveau) |
| ⚪ Grau | Getestete Zonen (bereits besucht) |
| 🟢 Grüner Pfeil | KAUF-Signal |
| 🔴 Roter Pfeil | VERKAUF-Signal |
============================================================
## Einfache Einstellungen für Anfänger
============================================================
### Für schnelles Trading (Scalping):
- Pivot-Periode: **15-Minuten**
- Schnelle MA: **5**
- Langsame MA: **13**
- Einschalten: Alle drei Werkzeuge
============================================================
### Für Daytrading:
- Pivot-Periode: **Täglich**
- Schnelle MA: **9**
- Langsame MA: **21**
- Einschalten: Alle drei Werkzeuge
============================================================
### Für langfristiges Trading:
- Pivot-Periode: **Wöchentlich**
- Schnelle MA: **21**
- Langsame MA: **55**
- Einschalten: Trend Dashboard + Pivot-Punkte
=========================================================
## Eine Regel zum Merken
=========================================================
**Handle nicht, wenn die Werkzeuge widersprüchlich sind!**
Wenn das Dashboard KAUF anzeigt, der Preis aber in einer roten Angebotszone ist – warte auf Klarheit.
Wenn das Dashboard VERKAUF anzeigt, der Preis aber in einer blauen Nachfragezone ist – warte auf Klarheit.
Die besten Trades entstehen, wenn ALLE Werkzeuge in dieselbe Richtung zeigen.
============================================================
## Schneller Start
1. Füge den Indikator deinem Chart hinzu
2. Lass alle Einstellungen zunächst auf Standard
3. Beobachte, wie sich der Preis an den farbigen Kästen und Linien verhält
4. Nach ein paar Tagen passe die Einstellungen an deinen Stil an
5. Nutze das Dashboard, um dein Konto in Echtzeit zu überwachen
============================================================
Das war's! Drei Werkzeuge, ein Indikator, einfaches Trading.
Zusammenfassung
1. Trend Dashboard: Displays short-term (blue line) and long-term (red line) moving averages, colored clouds indicating uptrend (blue) or downtrend (red), buy (green arrow) and sell (red arrow) signals, and an RSI bar showing overbought or oversold conditions. It also shows account balance, open positions, and simple text advice.
2. Supply & Demand Zones: Highlights important price levels with blue boxes for demand zones (buying areas), red boxes for supply zones (selling areas), and gray boxes for tested zones (less reliable). It includes breakout signals (BOS arrows) indicating potential trend continuation.
3. Pivot Points: Automatically calculates support and resistance levels with a gold pivot point line, blue resistance lines, and red support lines. Users can select pivot periods from 15-minute to monthly intervals for different trading styles.
The indicator supports multiple markets including Forex, Crypto, Stocks, and Indices, and provides visual signals such as crossovers, breakouts, and level touches. It is designed for various trading styles, from scalping to long-term trading, with recommended settings for each. The tool emphasizes trading only when all three components align in direction to improve trade clarity and consistency.
Kundenbewertungen
5 | 100 % | |
4 | 0 % | |
3 | 0 % | |
2 | 0 % | |
1 | 0 % |


