
Beschreibung
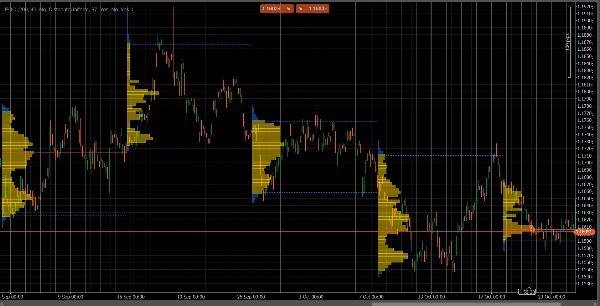
VolumeProfileSuite ist ein fortschrittlicher und flexibler Volume Profile Indikator für cTrader.
Sein Hauptzweck ist die Analyse der Volumenverteilung (d.h. wo Handelsaktivität auf verschiedenen Preisniveaus stattfand), um Bereiche von "Wert" (hohes Volumen) und "Ablehnung" (niedriges Volumen) zu identifizieren. Dies hilft Ihnen, die bedeutendsten Unterstützungs- und Widerstandsniveaus basierend auf realer Marktaktivität zu finden.
Sein einzigartiges Merkmal ist, dass es zwei leistungsstarke Analysemethoden in einem einzigen Werkzeug kombiniert, das über den Profile Mode Parameter auswählbar ist:
FixedRangeModus: Perfekt für Makro Analyse. Er ermöglicht die Analyse eines einzelnen, großen Blocks Ihrer Wahl (wie die letzten 1000 Balken oder einen bestimmten Datumsbereich, z.B. "die gesamte letzte Woche"). Ideal, um große, langfristige Unterstützungs-/Widerstandsniveaus zu finden.PeriodicModus: Perfekt für Mikro und Verhaltensanalyse. Er zeichnet automatisch alle "N" Balken ein neues Profil (z.B. alle 100 Balken). So können Sie sehen, wie sich der POC und der Value Area im Laufe der Zeit entwickeln und die sich wiederholenden Muster des Marktes studieren.- Parameteranleitung (Englisch)
Hier ist die aktualisierte Anleitung für Ihren neuen einheitlichen VolumeProfileSuite Indikator. Diese Anleitung ist entscheidend, da sie erklärt, welche Parameter je nach gewähltem Modus verwendet (und welche ignoriert) werden sollen.
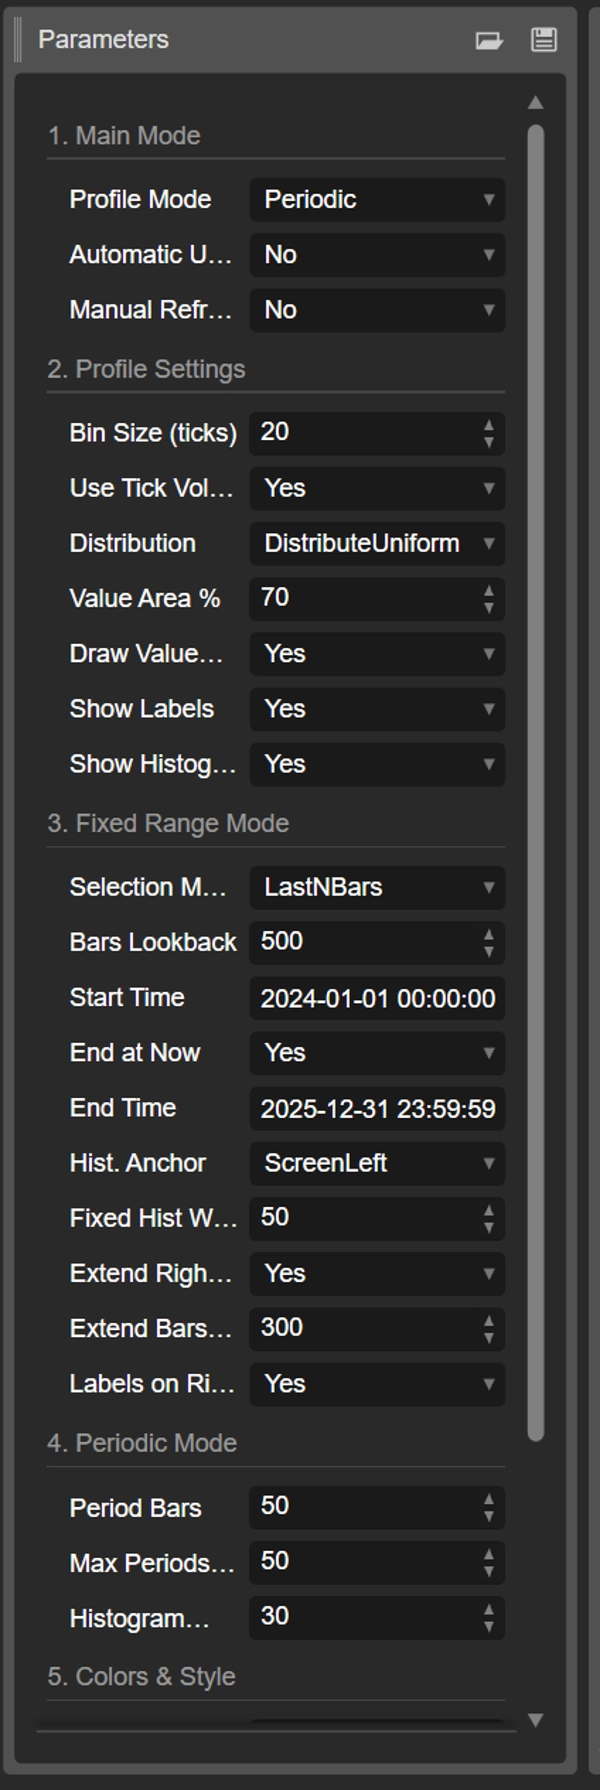
Gruppe 1: Hauptmodus
- Profile Mode: Dies ist der wichtigste Parameter und fungiert als Hauptschalter.
-
FixedRange: Aktiviert den "Einzelblock"-Modus. Der Indikator analysiert nur einen von Ihnen angegebenen Intervall (unter Verwendung der Einstellungen in Gruppe 3).Periodic: Aktiviert den "zyklischen" Modus. Der Indikator analysiert automatisch das gesamte Chart in Blöcken (basierend auf den Einstellungen in Gruppe 4).
WICHTIG: Im
FixedRangeModus müssen Sie alle Parameter in "Gruppe 4: Periodic Mode" ignorieren. ImPeriodicModus müssen Sie alle Parameter in "Gruppe 3: Fixed Range Mode" ignorieren.
Gruppe 2: Profileinstellungen
Diese Parameter sind gemeinsam und gelten für beide Modi (FixedRange und Periodic).
- Bin-Größe (Ticks): Steuert die vertikale "Auflösung" des Profils. Ein niedriger Wert (z.B.
1) erzeugt viele dünne Preisreihen (sehr detailliert). Ein hoher Wert (z.B.10) gruppiert Preise in dickere Reihen (weniger detailliert, "glatter"). - Tick-Volumen verwenden: Wenn
true(empfohlen), verwendet das Profil das reale Tick-Volumen, das sehr genau ist. Wennfalse, wird einfach "1" für jeden Balken gezählt. - Verteilung: Definiert, wie das Volumen eines Balkens verteilt wird.
-
DistributeUniform(Standard): "Verteilt" das Volumen des Balkens über alle Preisniveaus, die er berührt hat, von seinem Tief bis zu seinem Hoch.CloseOnly: Weist das gesamte Volumen des Balkens nur seinem Schlusskurs zu.
- Value Area %: Legt den Prozentsatz des Volumens fest, der die "Value Area" (den Bereich mit der höchsten Handelsaktivität) ausmacht. Ein Wert von
70(70%) ist der Marktstandard. - Value Area zeichnen (VAH/VAL): Wenn
true, werden die horizontalen Linien für den Value Area High (VAH) und Value Area Low (VAL) gezeichnet. - Labels anzeigen: Wenn
true, werden Textlabels ("POC", "VAH", "VAL") angezeigt. (Vorsicht: ImPeriodicModus kann dies das Chart überladen). - Histogramm anzeigen: Wenn
true, wird das Volumen-Histogramm (die horizontalen Balken) gezeichnet.
Gruppe 3: Fixed Range Modus
⚠️ Verwenden Sie diese Parameter NUR, wenn "Profile Mode" auf FixedRange eingestellt ist.
- Auswahlmodus: Wählt wie Ihr einzelner Block definiert wird.
-
DateRange: Verwendet ein spezifisches Start- und Enddatum/-zeit.LastNBars: Verwendet die letzten N Balken.
- Balken Rückblick: (Nur für
LastNBars) Wie viele Balken zurück analysiert werden sollen (z.B.500). - Startzeit / Endzeit jetzt / Endzeit: (Nur für
DateRange) Definiert den Anfang und das Ende Ihres Intervalls. - Hist. Anker: (Nur für
FixedRange) Definiert, wo das Histogramm verankert wird. -
DateRangeStart: Am Anfang Ihres Intervalls (kann außerhalb des Bildschirms sein).ScreenLeft: Am linken Rand des sichtbaren Fensters.ScreenRight: Am rechten Rand des sichtbaren Fensters (im leeren Bereich).
- Feste Histogrammbreite (Balken): Die Breite des Histogramms (in Balken) für den
FixedRangeModus. - Nur nach rechts erweitern: Wenn
true, werden die POC/VAH/VAL Linien in die Zukunft verlängert. - Balken erweitern: (Nur wenn
Extend Right Onlyauftruegesetzt ist) Wie viele Balken die Linien verlängert werden sollen. - Labels rechts: Wenn
true, werden Preislabels am rechten Ende der verlängerten Linien platziert.
Gruppe 4: Periodic Modus
⚠️ Verwenden Sie diese Parameter NUR, wenn "Profile Mode" auf Periodic eingestellt ist.
- Periodenbalken: Dies ist der Schlüssel Parameter für diesen Modus. Er definiert, wie viele Balken in jeden zyklischen Block einbezogen werden (z.B.
100). - Max. Perioden zum Zeichnen: 🌟 SICHERHEITSPARAMETER! Dieser begrenzt die Anzahl der gezeichneten zyklischen Profile, um einen Absturz von cTrader zu verhindern.
50bedeutet, dass nur die letzten 50 Profile gezeichnet werden, auch wenn mehr Historie vorhanden ist. Setzen Sie diesen Wert nicht zu hoch (z.B. > 200), da cTrader sonst einfrieren kann! - Histogrammbreite (Balken): Die Breite des Histogramms (in Balken) für jeden zyklischen Block.
Gruppe 5: Farben & Stil
Diese Parameter sind gemeinsam und gelten für beide Modi.
- POC-Farbe: Die Farbe der Point of Control Linie.
- VA-Farbe: Die Farbe der VAH- und VAL-Linien.
- Linienstärke: Die Dicke der POC-, VAH- und VAL-Linien.
- VA-Histogrammfarbe: Die Farbe der Histogrammbalken innerhalb des Value Area (Standard: Gelb).
- Außerhalb-Hist-Farbe: Die Farbe der Histogrammbalken außerhalb des Value Area (Standard: Blau).
- Histogramm-Deckkraft %: Die Transparenz (Deckkraft) des gesamten Histogramms.
Zusammenfassung
The indicator offers two main analysis modes selectable via the Profile Mode parameter:
1. FixedRange Mode: Analyzes a single user-defined interval, such as a specific date range or the last N bars, suitable for macro-level, long-term support and resistance identification.
2. Periodic Mode: Automatically segments the chart into consecutive blocks of N bars, drawing a new profile for each. This mode supports micro-level and behavioral analysis by tracking how the Point of Control (POC) and Value Area evolve over time.
Common configurable settings include bin size (price resolution), volume type (tick volume or bar count), volume distribution method, value area percentage, and visual options such as histogram display and labeling. FixedRange and Periodic modes have distinct parameter groups to tailor their respective analyses.
Color and style options allow customization of POC, Value Area lines, and histogram appearance. The tool supports various markets including Forex, indices, commodities, stocks, and cryptocurrencies, as indicated by its relevant tags.
Kundenbewertungen
5 | 50 % | |
4 | 50 % | |
3 | 0 % | |
2 | 0 % | |
1 | 0 % |


