

VWAP Stdev Bands
Indikator
Versi 1.0, Jul 2026
Windows, Mac

534.4M
Volum yang didagangkan
9.76M
Pip dimenangi
4
Jualan
Penerangan
Penerangan & Peraturan Perdagangan (Versi Bahasa Inggeris)
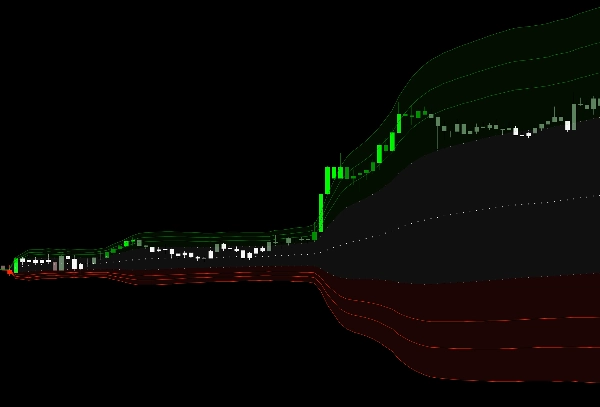
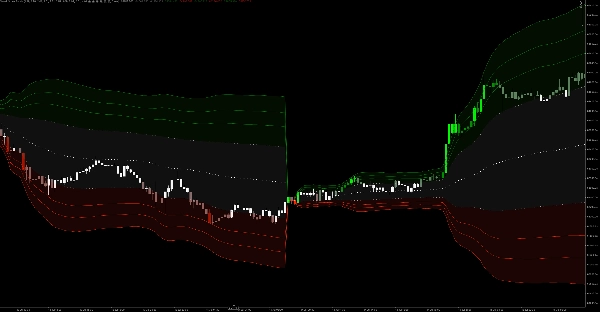
【Gambaran Keseluruhan Penunjuk】 Penunjuk ini berpusat pada VWAP Harian (Harga Purata Berwajaran Volum) dan berkembang ke luar dengan 5 peringkat jalur Sisihan Piawai (Stdev). Digabungkan dengan teknologi pewarnaan unik "Peta Haba Lilin" kami, ia bukan sahaja memaparkan zon sokongan dan rintangan dinamik tetapi juga menyerlahkan secara visual keadaan pasaran yang sangat terlebih beli dan terlebih jual, membantu pedagang menangkap peluang pembalikan purata dengan tepat.
【Peraturan Perdagangan】
- Zon Konsolidasi & Pemerhatian (Putih / Hijau Gelap / Merah Gelap): Apabila lilin kekal dalam jalur sisihan piawai ke-1 dan ke-2, harga berfluktuasi secara normal di sekitar purata bergerak. Mengikuti trend atau kekal di tepi disyorkan.
- Zon Trend Arah (Hijau / Merah Tua): Apabila lilin menembusi jalur ke-2 dan memasuki jalur ke-3, trend memasuki fasa pecutan dengan momentum yang kuat.
- Zon Pembalikan Ekstrem (Lime / Merah Terang): Apabila lilin mencapai jalur sisihan piawai ke-4 atau ke-5 dan warnanya berubah menjadi Lime atau Merah paling terang, ia menandakan sentimen pasaran yang sangat terlebih beli atau terlebih jual. "Pembalikan purata" (pembalikan tajam) sangat berkemungkinan berlaku, berfungsi sebagai isyarat yang sangat baik untuk mengambil keuntungan atau membuat kemasukan bertentangan (mengurangkan puncak/bawah).
Ringkasan
AI summary
VWAP Stdev Bands is a technical indicator centered on the Daily Volume Weighted Average Price (VWAP) enhanced with five tiers of standard deviation bands. It integrates a dynamic candlestick heatmap coloring system to visually represent support and resistance levels and highlight extreme market conditions. The indicator categorizes price action into zones: a consolidation zone within the first two standard deviation bands indicating normal fluctuation; a directional trend zone beyond the second band signaling strong momentum; and an extreme reversion zone at the fourth and fifth bands, marking overbought or oversold conditions likely to precede sharp reversals. This structure assists traders in identifying mean reversion opportunities and momentum phases. The indicator supports volume and bar data inputs and provides visual outputs suitable for trend analysis, volatility regime detection, reversal signals, breakouts, and level touches or breaks. It is designed for use in markets where VWAP and volume data are available.
Profil indikator
Kategori indikator
Trend
Jenis output
Visualisasi
Keperluan data
Bar sahaja
Volum
Isyarat yang disokong
Kemeruapan
Kekuatan trend
Pembalikan
Terobosan
Sentuhan paras
Pecahan paras
Ulasan pelanggan
0.0
Ulasan: 0
Ulasan pelanggan
Belum ada ulasan untuk produk ini. Anda sudah mencuba produk tersebut? Jadilah yang pertama untuk berkongsi pendapat anda!
Perbincangan
Soalan Lazim
Volume
Moving Average
VWAP
Support & Resistance
Produk yang tersedia melalui cTrader Store, termasuk bot dagangan, indikator dan plugin, disediakan oleh pembangun pihak ketiga dan diberikan akses untuk tujuan maklumat dan teknikal sahaja. cTrader Store bukan broker dan tidak memberikan nasihat pelaburan, syor peribadi atau sebarang jaminan prestasi masa hadapan.
Lebih banyak produk daripada penulis ini





















Harga
534.4M
Volum yang didagangkan
9.76M
Pip dimenangi
4
Jualan