

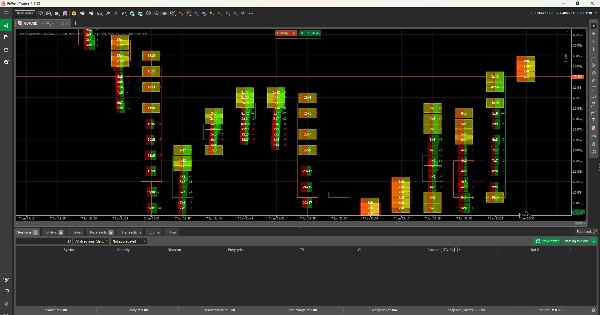
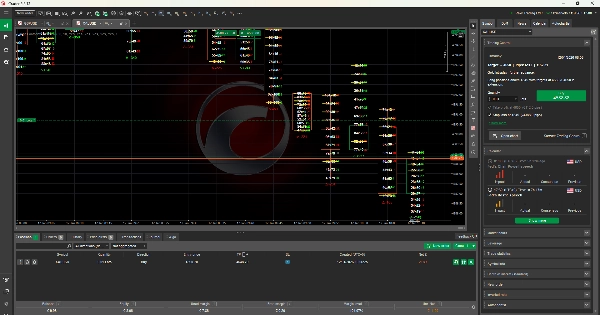
Delta Footprint Bid x Ask
Indicator
2 purchases
Version 2.0, Feb 2026
Windows, Mac
4.5
Reviews: 2
Since 15/01/2025
7
Sales
Description
What's Included:
- Overview - What the indicator does
- Footprint Concept - What is footprint trading
- Detailed Calculation Method - How the volumes are calculated:
- Price level creation
- Volume distribution algorithm
- Buy/sell split logic
- Example calculations
- Volume Display Explanation - What "45x120" means
- Delta Interpretation - Positive, negative, and cumulative
- Key Features - Imbalances, POC, volume bars
- Order Flow Theory - Bid vs Ask explanation
- Important Limitations - Honest explanation that it's estimated, not real tick data
- Trading Applications - 5 real-world trading scenarios
- Settings Guide - Complete explanation of all parameters
- Timeframe Recommendations - Best settings for different styles
- Tips & Best Practices
Key Points About Calculation:
The document clearly explains that:
Volumes are ESTIMATED - because cTrader doesn't provide real tick data Algorithm is intelligent - uses multiple factors (candle type, price position, close proximity) Patterns are accurate - relative relationships mirror real order flow Honest about limitations - explains when you need real exchange data Shows exact formulas - complete transparency on calculations
This gives users realistic expectations while highlighting the value of the indicator! 📊
Summary
AI summary
Delta Footprint Bid x Ask is a footprint volume indicator designed to display bid and ask volume splits at each price level. It estimates volume distribution using an intelligent algorithm that incorporates factors such as candle type, price position, and close proximity, as real tick data is not available on the cTrader platform. The indicator provides detailed volume calculations, including price level creation, buy/sell split logic, and example computations, offering transparency through exact formulas. Key features include identification of volume imbalances, point of control (POC), and volume bars, supporting analysis of order flow by comparing bid versus ask volumes. The indicator explains delta values—positive, negative, and cumulative—and offers guidance on settings and timeframe recommendations for various trading styles. It is applicable across multiple markets and symbols, including Forex pairs (EURUSD, GBPUSD, USDJPY, NZDUSD), indices (NAS100, SP500, DAX), commodities (gold, oil, silver), cryptocurrencies (BTCUSD), and stocks. The tool includes practical trading applications and best practices, helping users interpret footprint patterns that realistically mirror order flow despite volume estimates.
Indicator profile
Discussion
Customer reviews
4.5
Reviews: 2
5 | 50 % | |
4 | 50 % | |
3 | 0 % | |
2 | 0 % | |
1 | 0 % |
Customer reviews
January 20, 2026
For volume based context, this feels more useful as a filter than a full system. The journal should cover 55 setups and the trade context.
January 12, 2026
For me the fair test is value area with POC and VWAP. If the result still looks clean, the product becomes easier to trust.
FAQ
BTCUSD
Forex
Signal
Indices
EURUSD
Commodities
GBPUSD
NZDUSD
Prop
Scalping
Supertrend
Fair Value Gap
Crypto
Stocks
XAUUSD
NAS100
USDJPY
Products available through cTrader Store, including trading bots, indicators and plugins, are provided by third-party developers and made available for informational and technical access purposes only. cTrader Store is not a broker and does not provide investment advice, personal recommendations or any guarantee of future performance.
More from this author








!["Session Volume Profile (SVP) [Iridio Capital]" logo](https://cdn.ctrader.com/image/webp/b058beb7-b143-45f3-87d0-8c524c00b203_61552)














Price
Since 15/01/2025
7
Sales