
Renko Line Chart
Indicator
1 purchases
Version 1.0, Jun 2025
Windows, Mac

Description
✅ Uses professional formatting with clear hierarchy
✨ Why Traders Love It
"Finally - an indicator that looks as sophisticated as my trading strategy"
Summary
AI summary
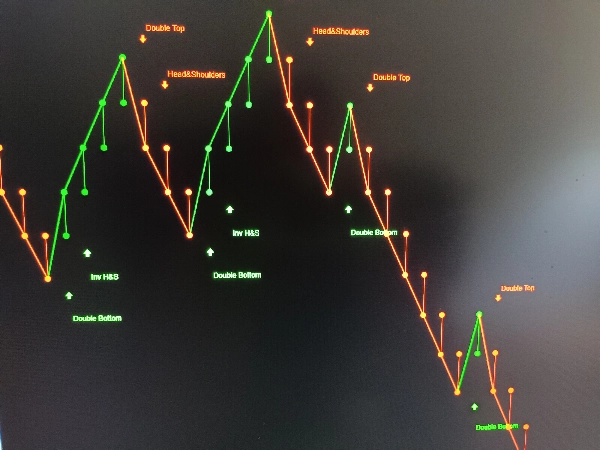
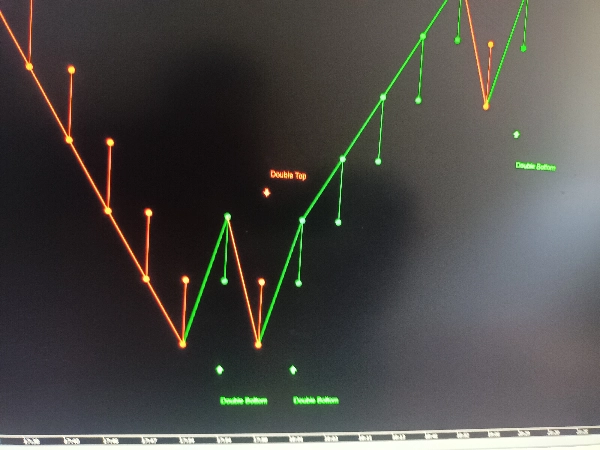
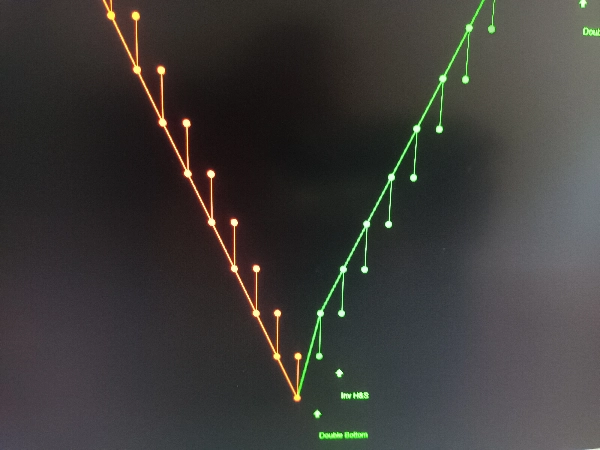
The Renko Line Chart is a trading indicator designed to present price movements with professional formatting and a clear hierarchical structure. It visually represents trend reversals and patterns using Renko charting techniques, which filter out minor price fluctuations to highlight significant market trends. This indicator aims to provide traders with a sophisticated and clear view of market dynamics, supporting decision-making based on trend signals. It is suitable for integration into various trading strategies that benefit from trend analysis and pattern recognition.
Indicator profile
Customer reviews
0.0
Reviews: 0
Customer reviews
No reviews for this product yet. Already tried it? Be the first to tell others!
Discussion
FAQ
Products available through cTrader Store, including trading bots, indicators and plugins, are provided by third-party developers and made available for informational and technical access purposes only. cTrader Store is not a broker and does not provide investment advice, personal recommendations or any guarantee of future performance.
More from this author


!["Gaussian Channel [Iridio Capital]" logo](https://cdn.ctrader.com/image/webp/7c039209-5573-4a54-a072-f9528b503103_41960)


Price
Since 28/01/2025
7
Sales
351
Free installs