
Penerangan
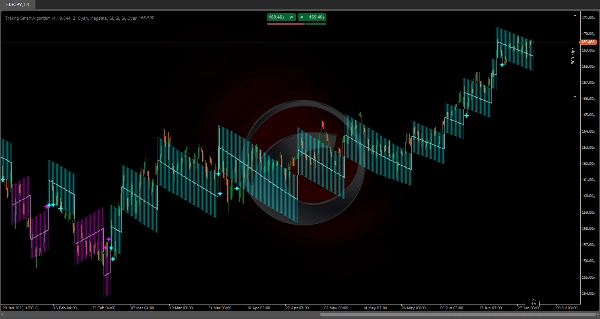
Algoritma Pintar Jejak
https://chartshots.spotware.com/c/69f0f1d89000b
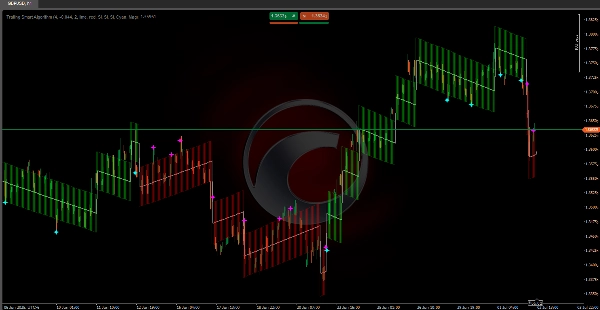
Menggabungkan algoritma matematik 🧠 yang direka khusus untuk sentiasa menjejaki harga dalam sebarang keadaan pasaran 🌐.
Struktur pengiraannya memastikan garis tren sentiasa selari dengan pergerakan harga, mengelakkan kelewatan biasa indikator tradisional ⏳.
Berbeza dengan algoritma konvensional, sistem ini menggunakan ukuran volatiliti tepat 📊 dan menerapkan pelarasan automatik ⚙️ yang menjamin penjejakan optimum. Pengiraan dalaman dibina untuk memberikan representasi tepat arah pasaran, mengekalkan ketepatan semasa pergerakan pantas ⚡ dan perkembangan tren secara beransur-ansur 🕊️.
https://chartshots.spotware.com/c/69f0f218591b0
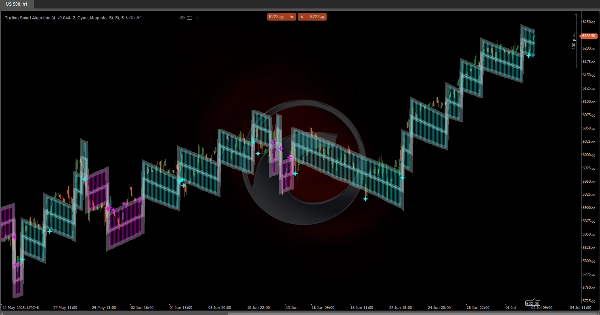
💡 Bagaimana Ia Berfungsi?
Penunjuk beroperasi menggunakan sistem langkah adaptif yang bergerak mengikut arah tren dominan.
Ia berdasarkan tiga komponen utama:
https://chartshots.spotware.com/c/69f0f2b19e4d3
1️⃣ Pengesanan Perubahan Tren
Sistem sentiasa memantau harga untuk mengesan pergerakan ketara melebihi ambang tertentu (Pencetus Impuls 🎯).
Apabila harga bergerak jauh dari garis tren semasa, penunjuk mengenal pasti potensi perubahan arah dan mengubah kedudukan garis utamanya.
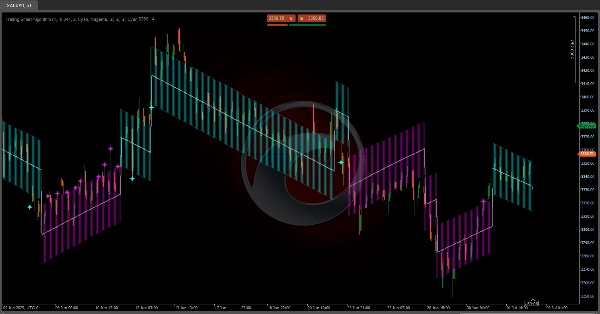
2️⃣ Jejak Dinamik
Setelah arah ditetapkan, garis tren bergerak langkah demi langkah 🪜 dalam arah yang sama dengan pasaran.
Setiap langkah dikira berdasarkan volatiliti semasa (ATR 📈):
• Dalam pasaran yang lebih tidak stabil, langkah lebih besar 🌊
• Dalam pasaran yang lebih tenang, langkah lebih kecil 🌿
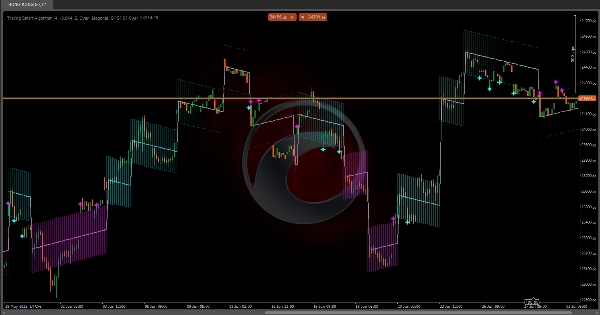
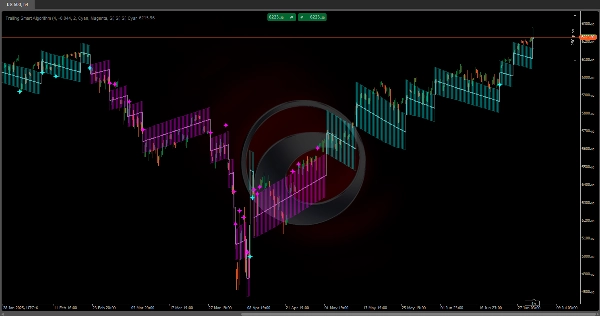
3️⃣ Saluran Volatiliti
Satu saluran terbentuk di sekitar garis utama (jalur atas dan bawah) yang mewakili zon volatiliti normal 📉📈.
Saluran ini membantu mengenal pasti sama ada harga berkelakuan dalam parameter normal atau membuat pergerakan ekstrem 🚨.
📏 Saluran Volatiliti
• Jalur Atas: Had atas saluran volatiliti
• Jalur Bawah: Had bawah saluran volatiliti
✨ Isyarat Ujian Semula
• Bintang Sian 🌟: Harga menyentuh atau melintasi jalur bawah semasa tren menaik
• Bintang Magenta ⭐: Harga menyentuh atau melintasi jalur atas semasa tren menurun
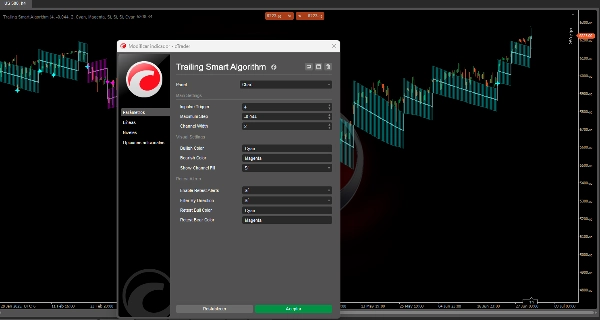
⚙️ Tetapan Parameter
🔹 Parameter Utama
Pencetus Impuls (nilai lalai: 4)
Apa fungsinya?
Menentukan kepekaan untuk mengesan perubahan tren. Ia adalah gandaan ATR yang menentukan berapa banyak harga perlu bergerak untuk mencetuskan perubahan arah.
Kesan apabila diubah:
• Nilai lebih tinggi (5–8):
- Lebih tahan terhadap perubahan tren 🛡️
- Isyarat palsu lebih sedikit
- Respons lebih lambat terhadap perubahan sebenar
• Nilai lebih rendah (2–3):
- Kepekaan lebih tinggi 🎯
- Reaksi lebih pantas
- Lebih cenderung menghasilkan isyarat palsu dalam pasaran mendatar
Langkah Maksimum (nilai lalai: -0.044)
Apa fungsinya?
Mengehadkan saiz maksimum setiap langkah yang boleh diambil oleh garis tren. Ia adalah nilai negatif yang bertindak sebagai had.
Kesan apabila diubah:
• Kurang negatif (-0.020 hingga -0.030):
- Langkah lebih besar 🚀
- Penjejakan tren lebih agresif
• Lebih negatif (-0.050 hingga -0.080):
- Langkah lebih kecil, lebih beransur-ansur 🌱
- Penjejakan lebih konservatif
Lebar Saluran (nilai lalai: 2)
Apa fungsinya?
Menentukan lebar saluran volatiliti di sekitar garis utama.
Kesan apabila diubah:
• Nilai lebih tinggi (3–4):
- Saluran lebih lebar 🟢
- Isyarat ujian semula lebih sedikit
- Toleransi lebih tinggi terhadap volatiliti
• Nilai lebih rendah (1–1.5):
- Saluran lebih sempit 🔴
- Isyarat ujian semula lebih banyak
- Lebih sensitif terhadap bunyi
🎨 Parameter Visual
Warna Bullish / Warna Bearish
Menentukan warna untuk tren menaik dan tren menurun masing-masing.
Tunjukkan Isian Saluran
Aktifkan atau nyahaktifkan isian visual saluran volatiliti 🌈.
🔔 Tetapan Ujian Semula
Aktifkan Amaran Ujian Semula
Togol isyarat ujian semula apabila harga menyentuh jalur saluran.
Tapis Mengikut Arah
Apabila diaktifkan, hanya menunjukkan isyarat ujian semula yang sepadan dengan tren semasa:
• Dalam tren menaik: Hanya isyarat pada jalur bawah
• Dalam tren menurun: Hanya isyarat pada jalur atas
🌟 Ringkasan Isyarat Ujian Semula
• Bintang Sian pada Jalur Bawah: Potensi pantulan bullish dari sokongan dinamik ✅
• Bintang Magenta pada Jalur Atas: Potensi pantulan bearish dari rintangan dinamik ❌
Ringkasan
Ulasan pelanggan
5 | 100 % | |
4 | 0 % | |
3 | 0 % | |
2 | 0 % | |
1 | 0 % |


