Açıklama
Pinescriptlabs Store göstergeleri: Pinescriptlabs Store cBotları : (cBot) Gold & BTC BreakoutOturum Pivotları(yeni)
SmartTrend Destek &
Direnç
Çizgileri
Dinamik
Piyasa Yapısı
Analizi
Dönüş
Noktaları
Analizi
Fibonacci
Doğrusal
Regresyon
Çok Zamanlı
Çok Katmanlı
Mum Önyargısı
Takipçisi
Otomatik
Destek ve
Direnç
Trend
Çizgileri
Tüm
Destek ve
Direnç
Düzeyleri
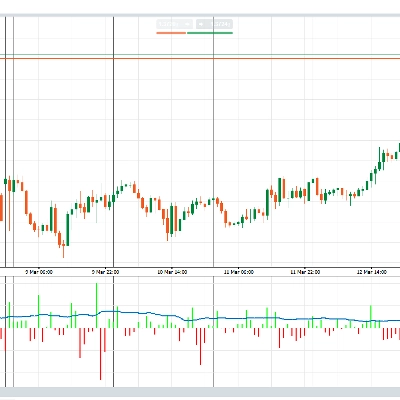
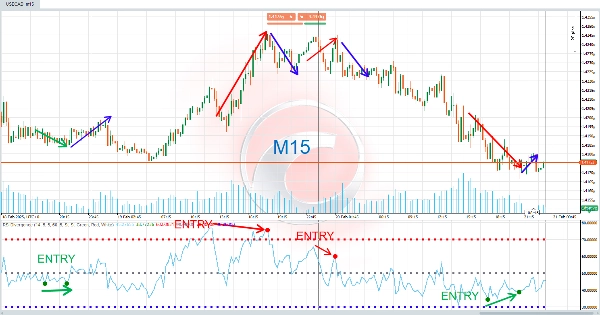
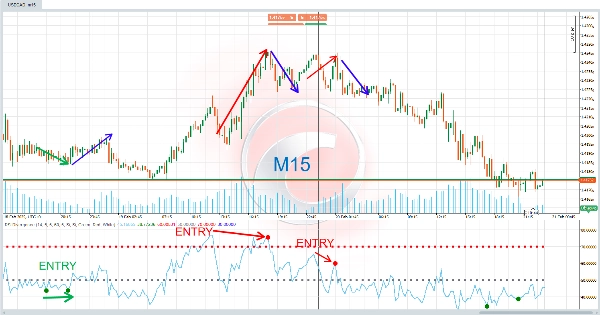
RSI Diverjansı, fiyat ile Göreceli Güç Endeksi (RSI) arasındaki farklılıkları tespit etmek için tasarlanmış gelişmiş bir teknik analiz aracıdır. Bu farklar, piyasa yönündeki değişiklikleri önceden haber verebilen güçlü sinyallerdir ve teknik traderlar için paha biçilmez bir kaynaktır. 🔍💡
⚙️ Nasıl Çalışır?
Bu gösterge, fiyatın ve RSI'nın her zaman senkronize hareket etmediği prensibine dayanır. Bir diverjans oluştuğunda, fiyatın altta yatan RSI trendine zıt bir sinyal gönderdiği anlamına gelir. Bu, mevcut trendin gücünü kaybediyor olabileceğine dair erken bir uyarı olabilir.
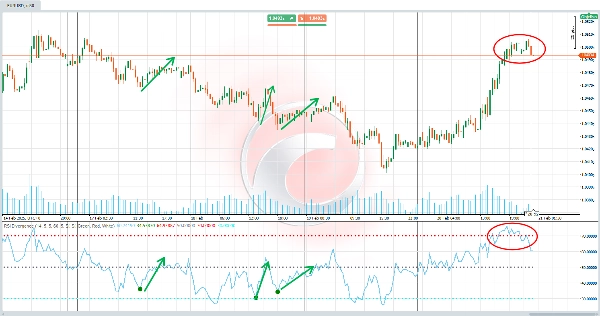
- Boğa Diverjansı (Yükseliş Trendi) 📈 :
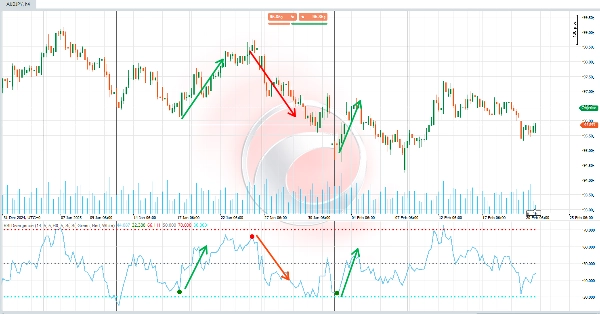
Fiyatın daha düşük dipler oluşturduğu, ancak RSI'nın daha yüksek dipler oluşturduğu durumlarda ortaya çıkar. Bu, fiyat düşerken yükseliş momentumunun güçleniyor olabileceğini ve potansiyel bir yukarı dönüşü işaret eder. ✅ - Ayı Diverjansı (Düşüş Trendi) 📉 :
Fiyatın daha yüksek tepeler oluşturduğu, ancak RSI'nın daha düşük tepeler oluşturduğu durumlarda ortaya çıkar. Bu, fiyat yükselirken düşüş momentumunun güçleniyor olabileceğini ve potansiyel bir aşağı dönüşü işaret eder. ❌
Gösterge, bu diverjansları otomatik olarak algılar ve kolay yorumlama için grafikte renkler, çizgiler ve etiketlerle vurgular. 🎯
💡 Ne İçin Kullanılır?
Bu gösterge özellikle şunlar için faydalıdır:
- Giriş ve çıkış noktalarını belirlemek : Diverjanslar alım (boğa) veya satım (ayı) sinyalleri olarak işlev görebilir. 🛒💸
- Trend değişikliklerini önceden görmek : Diverjanslar mevcut trendin gücünü kaybediyor olabileceğine dair erken sinyallerdir. ⚡
- Teknik analizi doğrulamak : Diğer göstergeler veya mum formasyonları ile birlikte kullanılarak işlem kararlarını doğrulamak için kullanılabilir. 🧠📊
Hem günlük işlemciler hem de uzun vadeli yatırımcılar için idealdir, çünkü diverjanslar her zaman dilimi için geçerlidir. ⏳📈
🛠️ Nasıl Kullanılır?
- İlk Kurulum:
-
- RSI periyodu, pivot arama aralıkları ve sinyal renkleri gibi parametreleri ihtiyaçlarınıza göre özelleştirin. 🎨⚙️
- Tercihlerinize bağlı olarak boğa veya ayı diverjanslarının gösterimini etkinleştirin veya devre dışı bırakın. ✅❌
- Sinyallerin Yorumlanması:
-
- Boğa Diverjansı : Grafikte yeşil "D" sinyali göründüğünde, olası bir alım fırsatını gösterir. 🟩🛒
- Ayı Diverjansı : Grafikte kırmızı "D" sinyali göründüğünde, olası bir satış fırsatını gösterir. 🟥🚫
- Ayrıca, diverjans noktalarını bağlayan çizgiler görsel analizi kolaylaştırmak için çizilir. 📐🔗
- Karar Verme:
-
- Bu sinyalleri pozisyon açma, mevcut işlemleri kapatma veya stop-loss seviyelerini ayarlama gibi stratejilerinizi düzenlemek için kullanın. 🤝💼
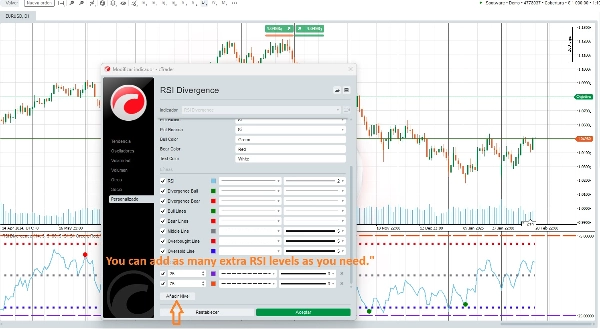
🆕 Gelişmiş Özelleştirme!
🌟 Kullanıcının istediği kadar RSI seviyesi ekleyebilir 🌟
Bu gösterge, işlem deneyiminizi tamamen özelleştirmenize olanak tanır. Farklı stratejilere ve işlem stillerine uyacak şekilde birden fazla RSI seviyesi ekleyebilirsiniz. Örneğin, ek aşırı alım ve aşırı satım seviyeleri yapılandırabilir veya farklı zaman dilimlerine uyacak şekilde RSI periyodunu ayarlayabilirsiniz. 🔄📈📉
Özet
Designed for use on any timeframe, the indicator helps traders identify entry and exit points, anticipate trend changes, and confirm other technical analysis signals. Users can customize parameters such as RSI period, pivot search ranges, signal colors, and enable or disable specific divergence types. Additionally, multiple RSI levels can be added to tailor the indicator to various trading strategies and styles.
This tool is suitable for intraday traders and long-term investors across markets including cryptocurrencies (e.g., BTCUSD), commodities (e.g., gold, XAUUSD), and indices. It supports enhanced decision-making by providing early warnings of trend strength shifts based on RSI divergence analysis.
Müşteri değerlendirmeleri
5 | 0 % | |
4 | 100 % | |
3 | 0 % | |
2 | 0 % | |
1 | 0 % |