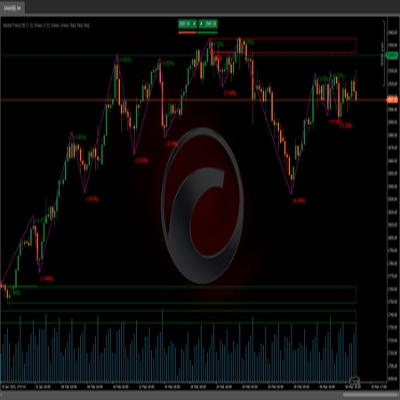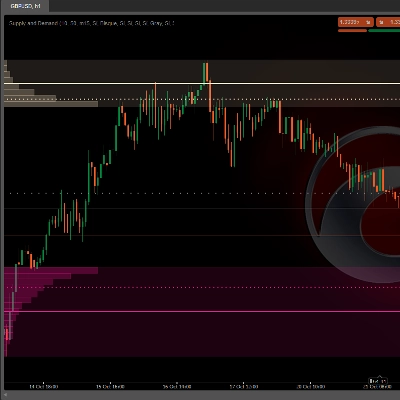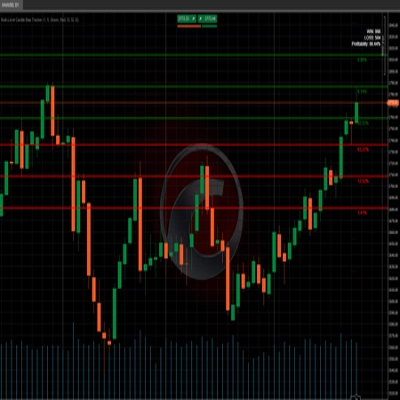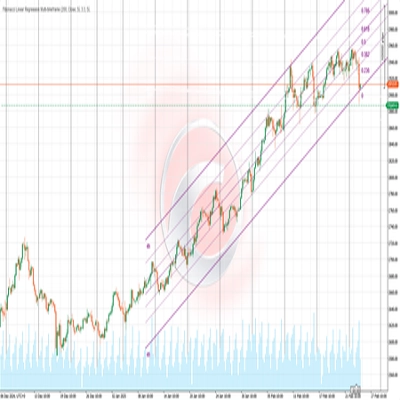
present
Kaydolun ve ilk alışverişinizde $50 indirim kazanın
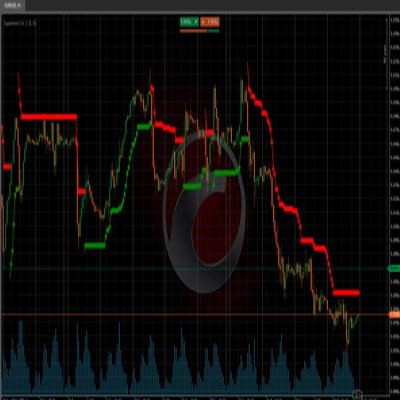
Trading product for Supertrend Gösterge BTCUSD Breakout, image 1
Supertrend
4.3
Değerlendirmeler: 3
Başlangıç 03/10/2024
178
Satışlar
45.55K
Ücretsiz yüklemeler

Açıklama

Pinescriptlabs Store göstergeleri:                        Pinescriptlabs  Store cBots :  (cBot) Gold & BTC BreakoutSession Pivots(yeni)

FİYAT HAREKETİ  (Yeni)

Takip Eden Akıllı Algoritma (yeni)

S&R Yapısal ZigZag                                

ZigZag

 BOS & CHOCH

Bölgeler Arz Talep

Kaldıraç Tasfiye Haritası

Otomatik Trend Kanalı


Hacim POC Isı Haritası


PREMIUM SSL KANALI

Linreg & ATR Tabanlı Tahmin

 ICT 3 Gücü 
                                                   

AkıllıTrend Destek &
Direnç
Çizgileri
       

Adil Değer Boşluk Seansları                


RSI Trend Tetikleyici

Kanal Kırılım Sistemi

Süpertrend

Piyasa Dengesizliği

Uyarlanabilir Trend Kanalı 

Dinamik
Piyasa Yapısı
Analizi
Dönüş
Noktaları
Analizi

Emir Bloğu

Fibonacci
Doğrusal
Regresyon
Çok Zamanlı

Dinamik RSI

Momentum Adil Değer Boşluğu

Piyasa Akışı Projeksiyonu

Dinamik Trend Gradyanı

Çok Katmanlı
Mum Önyargısı
Takipçisi

Zig-Zag Uç Nokta Takipçisi

Reaktif Hareketli Ortalama

Otomatik
Destek ve
Direnç
Trend
Çizgileri

Tüm
Destek ve
Direnç
Düzeyleri

Dinamik Aralık Momentum

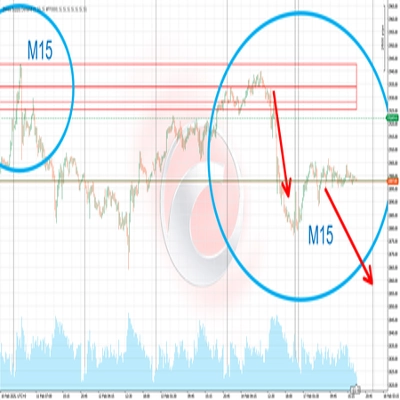
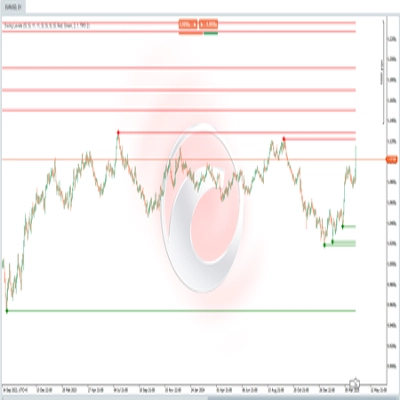
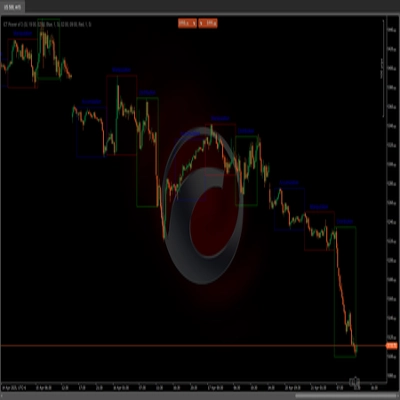
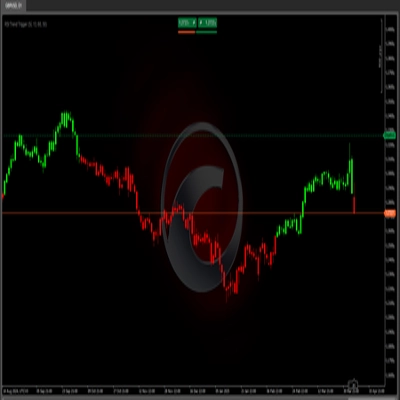
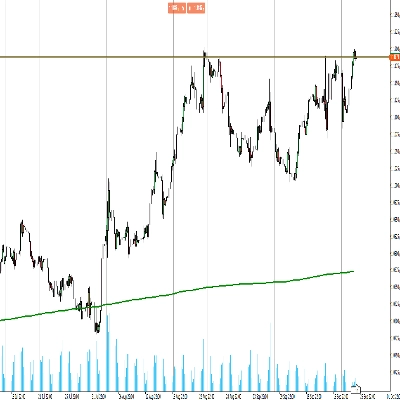
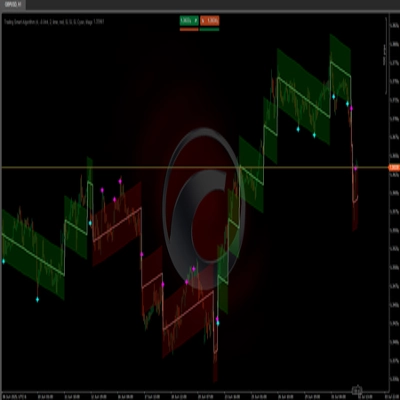
🚀 **Trend Takip Algoritması** ki bu, **Ortalama Gerçek Aralık (ATR)** 📊 kullanarak bir fiyat kanalı 📈 tanımlar ve trend yönünü belirler (boğa 🟢 veya ayı 🔴). Gösterge, trend bazında renk değiştirir ve çizgiler çizer, böylece piyasa momentumu değişimlerini görselleştirmeyi kolaylaştırır. 💹


### 🔧 **Girdiler**:


1. **ATR Periyotları** ⏳:

- **Ortalama Gerçek Aralık** hesaplamak için periyot sayısını tanımlar. Bu, göstergenin hassasiyetini etkiler ve piyasa hareketlerini daha hızlı veya daha yavaş yakalamanıza yardımcı olur.


2. **ATR Çarpanı** 🔍:

- Piyasa volatilitesine 🌊 bağlı olarak trend çizgileri 📉 arasındaki mesafeyi ayarlar. Daha yüksek bir değer kanalı genişletir, yanlış sinyalleri azaltır ancak büyük piyasa hareketlerini daha net görmenizi sağlar. 📐


Özet

YZ özeti
The Supertrend indicator is a trend-following tool that uses the Average True Range (ATR) to define a dynamic price channel and identify market trend direction as bullish or bearish. It visually represents trend shifts by changing colors and drawing lines on the price chart, facilitating the recognition of momentum changes. Key adjustable inputs include the ATR Periods, which set the number of periods for ATR calculation affecting sensitivity, and the ATR Multiplier, which adjusts the channel width based on market volatility to balance signal accuracy and noise reduction. This indicator supports analysis across various markets including cryptocurrencies (e.g., BTCUSD), commodities (e.g., gold, XAUUSD), and others. It is designed to help traders visualize and follow prevailing trends by providing clear, adaptive trend signals derived from price action and volatility measures.
Gösterge profili

Tartışma

Müşteri değerlendirmeleri

4.3
Değerlendirmeler: 3
5
33 %
4
67 %
3
0 %
2
0 %
1
0 %
Müşteri değerlendirmeleri
October 6, 2024
Useful in the right hands if the trader wants it helps keep attention on the broader move. It works best as support, not a final decision maker. I would judge the trend read across 3 sessions, with at least 2 higher timeframe candles agreeing. sideways markets can weaken the signal.
October 5, 2024
October 5, 2024
Solid option for review for traders who prefer directional setups. It gives value around trend filtering, but sideways markets can weaken the signal. The signal feels safer when trend strength is clear and DD stays under 3 percent. It is a filter for bias, not a reason to ignore risk.

SSS

BTCUSD
Breakout
Supertrend
Commodities
RSI
Crypto
XAUUSD
ATR
cTrader Store üzerinden erişilebilen işlem botları, göstergeler ve eklentiler gibi ürünler, üçüncü taraf sağlayıcılar tarafından sağlanır ve yalnızca bilgilendirme ve teknik erişim amaçlarıyla sunulur. cTrader Store bir broker değildir ve yatırım tavsiyesi, kişisel öneriler vermez veya gelecekteki performansı garanti etmez.

Bu oluşturanın diğer ürünleri

"ZigZag" logosu
4.3
(6)
Ücretsiz
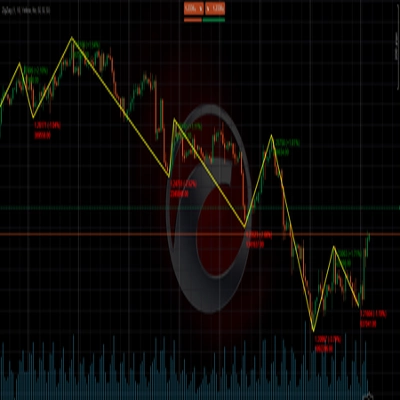
ZigZag filters noise, spots trends, patterns, pivots, aiding analysis, trade management, and confirmations. 📉📈
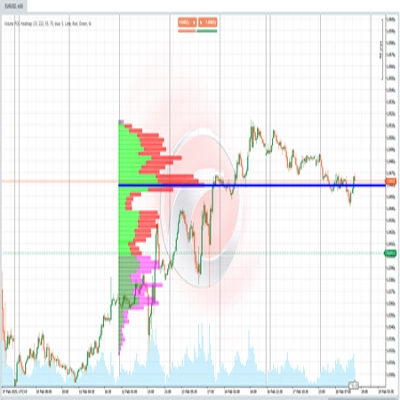
📊 Shows volume by price levels, highlights POC, and key zones. Identifies dynamic support/resistance and imbalances.
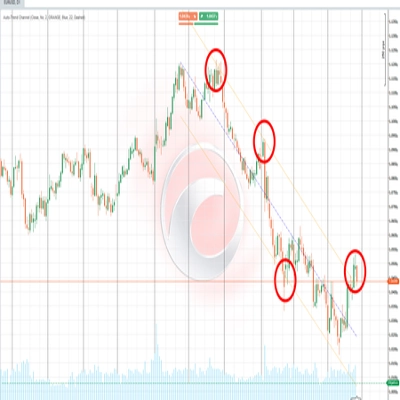
Adaptive trend channel using linear regression and Pearson correlation for dynamic support, resistance, and trends.
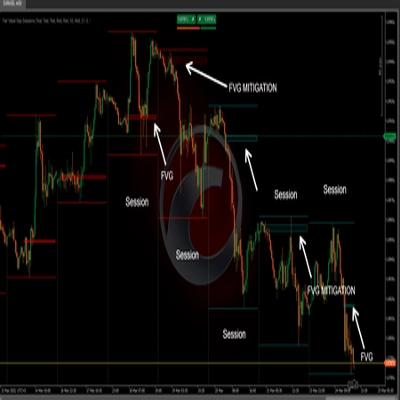
identify and highlight temporary market inefficiencies known as "fair value gaps" 🚨 within specific trading Sessions.
📊Zones Supply & Demand: Identifies key price levels with high volume concentration, marking Supply/Demand Zones & Marke
🔍 Automatically detect support and resistance levels based on "swings" or pivots
🎯 Auto-plots key zones (Accumulation, Manipulation, Distribution) . Reveals institutional traps & trends.
RSI Trend Trigger 📈: Uses dual-layer RSI to spot trends & generate clear buy/sell signals.
Price action to detect when the market changes trend (MSB) and defines, order blocks , ZigZag etc.📊
Auto Supply and Demand Automatically identifies the zones of highest trading activity on your chart. 📊
Price direction by calculating the probability of reaching new highs/lows. Shows levels & stats📈
Combining Fibonacci levels and regression to analyze multidimensional market trends across multiple timeframes¡

Şunları da beğenebilirsiniz

Auto Fibonacci Retracement Pro – Smart Swing & Golden Zone Levels
Customize your Moving Average! Choose any timeframe and price source for precision and flexibility in your analysis.
Super Trend Rsi ,ATR + trend change distance + dynamic Alpha, divergence/convergence
Trailing algo 📈 auto-tracks trends 🎯 adapts to volatility 🌟 precise moves 🛡️ retest signals 🚀 no lag, smart market
"CandleCounterAlex" logosu
4.7
(4)
$19
CandleCounterAlex – Candle Cycle Counter with Colors and Adjustable Position.
GOLD SENTINEL v1.0 - A CANDLE-COLORING INDICATOR FOR GOLD.
LevelMaster S/R: Pinpoint key support & resistance zones with precision. Perfect for traders of all levels Trade smarter
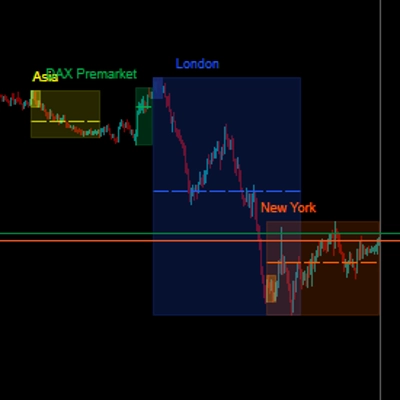
Sessions PRO is a professional session visualization indicator - 4 Fully Customizable Sessions
Protect your funded account. Real-time Daily Equity Drawdown monitor with Green / Orange / Red flashing alerts.
🚀 HALF TREND Indicator - The Ultimate Trend Following System 🚀
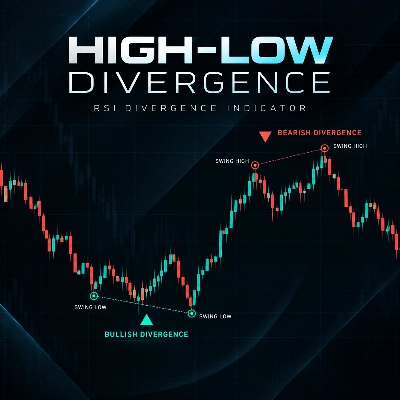
High Low Divergence is a clean, overlay indicator that automatically identifies swing highs and swing lows
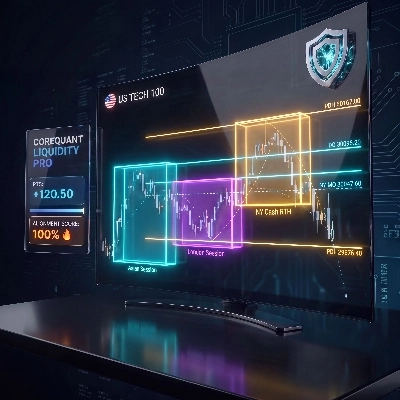
Institutional Nasdaq Session Liquidity Map with Live Point HUD, Sweep Alerts & Interactive Playbook.
Volume Profile Pro v2 - A Lightweight and Highly Customizable Side & Range Volume Profile
Multi-symbol Inside Bar Scanner with dashboard & breakout alerts
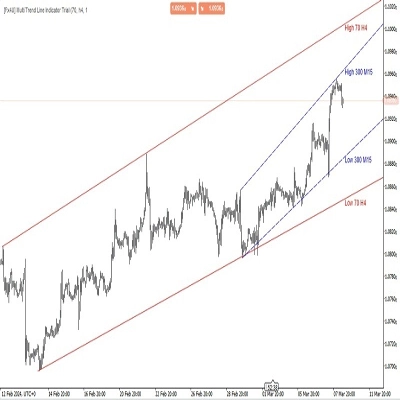
Allow trader to draw multi trendlines in different timeframes on one chart,Give trader an overview of the current market
It combines the trend-filtering power of Renko charts with the volatility tracking of ATR Bands
RSI on the main chart with 45/55 momentum levels, overbought/oversold levels, averaged RSI, and multi-timeframe support.
Customize your Moving Average! Choose any timeframe and price source for precision and flexibility in your analysis.

Fiyat

Başlangıç 03/10/2024
178
Satışlar
45.55K
Ücretsiz yüklemeler