
Açıklama
Pinescritlabs
Ctrader Store göstergeleri: 🤖Pinescritlabs Ctrader Store cBots:
Adil Değer Boşluğu Oturumları Altın & BTC Kırılma Oturumu Dönüm Noktaları(yeni)
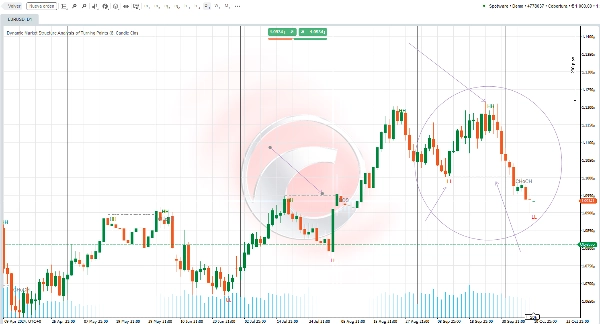
Dinamik Piyasa Yapısı
Dönüş Noktalarının Analizi
Fibonacci Lineer
Regresyon Çok Zamanlı Çerçeve
Çok Katmanlı Mum Eğilimi
Takipçisi
Otomatik Destek ve
Direnç Trend Çizgileri
Tüm Destek ve
Direnç Seviyeleri
Gösterge Ayarları Genel Bakış 🌟
SALINIM UZUNLUĞU 📏
Bu parametre, salınım noktalarını ararken sola ve sağa kaç barın dikkate alınacağını belirler. Daha düşük bir değer daha fazla nokta gösterirken, daha yüksek bir değer miktarlarını azaltır. Bu parametrenin ticaret tarzınıza ve farklı zaman dilimleri arasında geçiş yaparken ayarlanması önerilir.
CHOCH 🔄
Bu seçenek etkinleştirildiğinde, ilk karşı trend kırılma CHoCH (Karakter Değişimi) olarak yeniden adlandırılır ve böylece piyasa yönünde olası bir değişikliği gösterir.
HH ve LL 📈📉
Gösterge, grafik üzerinde salınım yüksek noktalarını (HH) ve salınım düşük noktalarını (LL) çizer, böylece piyasa yapısını daha etkili görselleştirmenizi sağlar.
BOS ⚡
Gösterge ayrıca, salınım noktalarında kırılmaları algıladığında Yapı Kırılması (BOS) seviyelerini gösterir ve piyasa dinamikleri hakkında ek bilgiler sunar.
Özet
Müşteri değerlendirmeleri
5 | 33 % | |
4 | 67 % | |
3 | 0 % | |
2 | 0 % | |
1 | 0 % |


