
QX SessionBox ORB
مؤشر
4 عمليات الشراء
الإصدار 1.0، Dec 2025
Windows, Mac
5.0
التقييمات: 2
الوصف
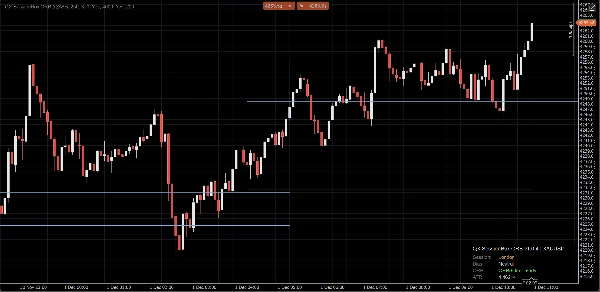
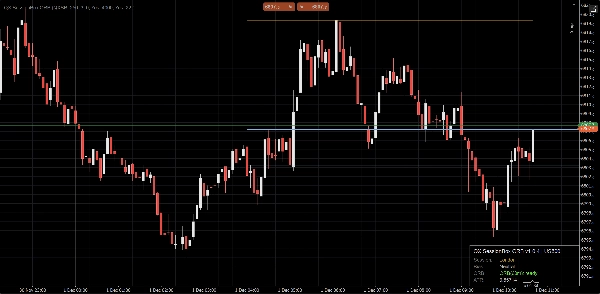
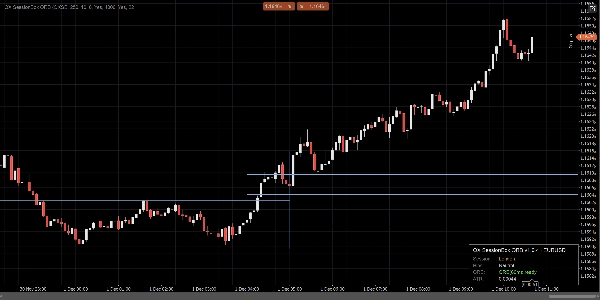
QX SessionBox ORB هو تراكب جلسة نظيف + نطاق الافتتاح (ORB) لـ cTrader.
يسلط الضوء على آسيا ولندن ونيويورك مع أقل قدر من ازدحام المخطط، يبني نطاق الافتتاح لأول X دقائق، ويحافظ على مستويات ORB العليا/الدنيا مرئية كهيكل يومي موضوعي. تعرض لوحة مدمجة حالة الجلسة والانحياز حتى تتمكن من قراءة السياق في ثوانٍ.
ما تحصل عليه
- مربعات جلسات آسيا / لندن / نيويورك (نطاقات زمنية وألوان مخصصة)
- نطاق الافتتاح (ORB) لأول دقائق ORB
- خطوط ORB العليا / ORB الدنيا (لون وعرض ونمط مخصص)
- مربع ORB اختياري (تمييز النطاق)
- لوحة تحكم مدمجة (الجلسة، حالة ORB، الانحياز، ATR)
- تأكيدات اختراق اختيارية (شمعة مغلقة فقط، مستقرة)
الوضع المتقدم الاختياري
- دعم الجلسات المتداخلة (اختياري)
-
- رسم مربعات جلسات متعددة عندما تتداخل أوقات الجلسات
- الجلسة الأساسية تتحكم في اللوحة والإشارات وخطوط مرجعية ORB (قابلة للتكوين)
كيفية استخدامه (سير عمل بسيط)
- قم بإرفاق QX SessionBox ORB على مخططك.
- قم بتعيين تعويض توقيت الجلسة UTC لمطابقة ساعات الجلسة المقصودة.
- اختر دقائق ORB (شائع: 15، 30، 60).
- أثناء بناء ORB، تعرض اللوحة جارٍ البناء. بعد ذلك تصبح جاهزة.
- استخدم مستويات ORB كهيكل:
-
- السعر فوق ORB العالي: ضغط صعودي للجلسة
- السعر تحت ORB المنخفض: ضغط هبوطي للجلسة
- السعر داخل ORB: سلوك نطاق (السياق مهم)
- (اختياري) قم بتمكين رسم الإشارات:
-
- CrossOnly (افتراضي): إغلاق الشمعة خارج حدود ORB
- State: يؤكد عندما ينتقل السعر إلى حالة صعودية/هبوطية
- (اختياري) قم بتمكين مرشح ATR لتقليل الاختراقات الضعيفة (k ATR هو التحكم الرئيسي في الحساسية).
مصمم للمخططات الحقيقية
- منطق الشمعة المغلقة للاستقرار والوضوح (لا وميض داخل الشمعة)
- تحديثات محدودة لاستهلاك أقل لوحدة المعالجة المركزية
- الاحتفاظ بأحدث الجلسات لمنع الازدحام
- تمهيد التاريخ خيار لملء الجلسات الأخيرة بسرعة
- سلوك الحافة اليمنى النظيفة (لا حيل تمديد المخطط)
ملاحظات
- هذه أداة دعم اتخاذ قرار بصري. لا تقوم بوضع صفقات وليست نصيحة مالية.
- تستخدم الجلسات UTC + تعويض يدوي (لا يوجد أتمتة لتوقيت الصيف).
- يتم التحكم في طول الرسم التاريخي بواسطة أشرطة التمهيد و الاحتفاظ بأحدث الجلسات.
- "شاهد الجلسة. علم النطاق. تداول الاختراق بوضوح."
أبرز المعلمات (سريع)
- دقائق ORB: طول نافذة نطاق الافتتاح
- لون / عرض / نمط خط ORB: مظهر ORB العالي/المنخفض
- استخدام مرشح ATR + k ATR: التحكم في صرامة الاختراق
- وضع الإشارة: CrossOnly (نظيف) أو State (أكثر بصرية)
- السماح بتداخل الجلسات: مربعات جلسات متعددة عندما تتداخل الأوقات
- الاحتفاظ بأحدث الجلسات: عدد الجلسات السابقة التي تبقى على المخطط
- تحديد التحديث (مللي ثانية): الأداء مقابل الاستجابة
الملخص
ملخص الذكاء الاصطناعي
QX SessionBox ORB is an indicator for cTrader that visually overlays trading sessions and Opening Range Breakout (ORB) levels on price charts. It highlights the Asia, London, and New York sessions with customizable time ranges and colors, minimizing chart clutter. The indicator builds the Opening Range for a user-defined number of minutes and displays ORB High and Low lines as key intraday structure levels, with adjustable appearance settings.
A compact dashboard panel provides real-time session status, ORB readiness, bias, and Average True Range (ATR) information for quick context assessment. Optional features include an ORB range highlight box, closed-candle breakout confirmation signals, and an ATR filter to reduce false breakouts. An advanced mode supports overlapping sessions, allowing multiple session boxes to display when session times overlap, with configurable primary session control.
Designed for stability and efficiency, QX SessionBox ORB uses closed-candle logic to avoid intrabar flicker, throttled updates for lower CPU usage, and options to keep a set number of past sessions visible. Users set session UTC offsets manually and can customize parameters such as ORB minutes, signal modes, and update frequency. The tool serves as a visual decision-support aid for intraday breakout trading across various markets including Forex, indices, commodities, and cryptocurrencies.
ملف تعريف المؤشر
تقييمات العملاء
5.0
التقييمات: 2
5 | 100 % | |
4 | 0 % | |
3 | 0 % | |
2 | 0 % | |
1 | 0 % |
مناقشة
الأسئلة الشائعة
BTCUSD
Forex
Signal
Breakout
Indices
EURUSD
Commodities
GBPUSD
NZDUSD
RSI
Bollinger
Fibonacci
Scalping
Grid
Stocks
AI
XAUUSD
NAS100
ATR
USDJPY
VWAP
يتم توفير المنتجات المتاحة من خلال cTrader Store، بما في ذلك روبوتات التداول والمؤشرات والإضافات، من قبل مطوري الطرف الثالث وإتاحتها لأغراض الوصول المعلوماتي والفني فقط. cTrader Store ليس وسيطًا ولا يقدم نصائح استثمارية أو توصيات شخصية أو أي ضمان للأداء المستقبلي.


![شعار "[Stellar Strategies] Inside Bar with Signals"](https://cdn.ctrader.com/image/webp/1d9e8bfa-3b2c-4440-bb37-5856902008a7_30683)


السعر
41.97M
حجم التداول
208.53K
الربح بالبيب
14
المبيعات
362
التثبيتات المجانية