
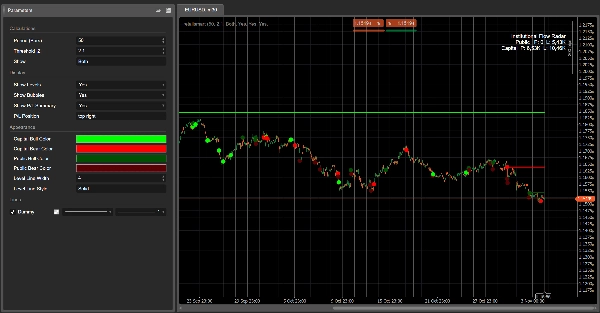
Institutional Flow Radar
مؤشر
3 عمليات الشراء
الإصدار 1.0، Nov 2025
Windows, Mac
4.3
التقييمات: 3
الوصف
رادار تدفق المؤسسات – الوصف
المفهوم:
يقوم رادار تدفق المؤسسات بمسح المخطط بحثًا عن أحداث حجم غير طبيعية ويصنفها إلى مجموعتين:
- رأس المال → النشاط المنسوب إلى المشاركين الأقوى / الأكثر اطلاعًا
- الجمهور → النشاط المنسوب إلى الحشد الأوسع
ثم يقوم بـ:
- رسم مستويات أفقية عند تلك الأحداث،
- تمييز الأحداث الأكثر صلة بفقاعات ملونة،
- وعرض ملخص الأرباح / الخسائر يقارن مقدار حجم رأس المال مقابل الجمهور الذي يحقق ربحًا أو خسارة حاليًا.
بنظرة واحدة، ترى أين ضرب الحجم الكبير الشريط، من هو الفائز، و أي الأسعار لا تزال ثابتة.
كيف يعمل (النسخة المختصرة)
- لكل شريط، يحسب الخوارزمية درجة Z للحجم على آخر N أشرطة (الفترة).
- إذا كانت قيمة درجة Z المطلقة أعلى من العتبة |Z| الخاصة بك، يتم وسم ذلك الشريط كـ حدث حجم.
- يتم استخدام هيكل الشمعة (الجسم مقابل النطاق الكلي) لتصنيف الحدث:
-
- جسم أصغر، فتائل طويلة → رأس المال (امتصاص / سلوك أكثر تعقيدًا)
- جسم أكبر، حركة اتجاهية → الجمهور (اختراق / مطاردة بأسلوب الحشد)
- يتم رسم مستوى أفقي عند سعر الحدث ويُحتفظ به حتى يتداول السعر بوضوح عبر ذلك المستوى (التخفيف).
- لكل مستوى نشط، يتحقق الرادار مما إذا كان السعر الحالي:
-
- في ربح لذلك الجانب (تحرك السعر في اتجاه الحدث)، أو
- في خسارة (تحرك السعر ضده).
- تجمع صندوق ملخص الأرباح / الخسائر أحجام جميع المستويات النشطة:
-
- ربح رأس المال مقابل خسارة رأس المال
- ربح الجمهور مقابل خسارة الجمهور
العناصر المرئية
- مستويات رأس المال:
-
- أحداث صعود → مستوى رأس مال صاعد (مثل أخضر فاتح / أزرق مائي)
- أحداث هبوط → مستوى رأس مال هابط (مثل أحمر فاتح)
- مستويات الجمهور:
-
- أحداث صعود → مستوى جمهور صاعد (لون رمادي)
- أحداث هبوط → مستوى جمهور هابط (رمادي داكن / فحم)
- الفقاعات:
-
- دوائر على الأحداث الأكثر أهمية، ملونة حسب:
-
- الاتجاه (صاعد/هابط)
- الفئة (رأس المال / الجمهور)
- صندوق ملخص الأرباح / الخسائر:
-
- الصفوف: الجمهور، رأس المال
- الأعمدة: الربح، الخسارة
- تزداد كثافة خلفية الخلية مع الحجم المقابل.
تسميات المعلمات المقترحة (بالإنجليزية)
- الفترة (الأشرطة): عدد الأشرطة المستخدمة لحساب درجة Z للحجم.
- العتبة |Z|: الحد الأدنى لقيمة درجة Z المطلقة لوضع علامة على حدث.
- عرض:
رأس المال،الجمهور، أوكلاهما– أي فئة للعرض. - عرض المستويات / عرض الفقاعات / عرض ملخص الأرباح والخسائر
- لون صعود رأس المال / لون هبوط رأس المال
- لون صعود الجمهور / لون هبوط الجمهور
- عرض الخط المتوسط / نمط الخط المتوسط
الملخص
ملخص الذكاء الاصطناعي
Institutional Flow Radar is a trading indicator that identifies and classifies abnormal volume events on price charts into two categories: Capital (activity from stronger or more informed participants) and Public (activity from the broader crowd). It calculates a volume Z-score for each bar over a specified period and flags bars exceeding a set threshold as volume events. These events are further classified based on candle structure—smaller bodies with long wicks indicate Capital activity, while larger bodies with directional moves indicate Public activity.
The indicator visually marks these events by drawing horizontal levels at event prices, which remain until price moves decisively through them. Significant events are highlighted with colored bubbles indicating direction (bullish or bearish) and classification (Capital or Public). A P/L summary box aggregates volume at active levels, showing Capital and Public volumes currently in profit or loss.
Users can customize parameters such as the period for Z-score calculation, threshold for event detection, and visual settings including colors for bullish and bearish levels for both Capital and Public groups. This tool provides a consolidated view of where large volume occurred, which participant group is prevailing, and which price levels are holding, aiding in volume-based breakout analysis.
ملف تعريف المؤشر
تقييمات العملاء
4.3
التقييمات: 3
5 | 33 % | |
4 | 67 % | |
3 | 0 % | |
2 | 0 % | |
1 | 0 % |
تقييمات العملاء
November 18, 2025
The only reason it stays interesting is the trading notes stop feeling so random, and two sessions say more than one clean chart.
November 9, 2025
مناقشة
الأسئلة الشائعة
Breakout
يتم توفير المنتجات المتاحة من خلال cTrader Store، بما في ذلك روبوتات التداول والمؤشرات والإضافات، من قبل مطوري الطرف الثالث وإتاحتها لأغراض الوصول المعلوماتي والفني فقط. cTrader Store ليس وسيطًا ولا يقدم نصائح استثمارية أو توصيات شخصية أو أي ضمان للأداء المستقبلي.


السعر
42.11M
حجم التداول
6.13M
الربح بالبيب
222
المبيعات
8.39K
التثبيتات المجانية