
Consolidation Zones
مؤشر
1 عمليات الشراء
الإصدار 1.0، Oct 2025
Windows, Mac
4.0
التقييمات: 1
الوصف
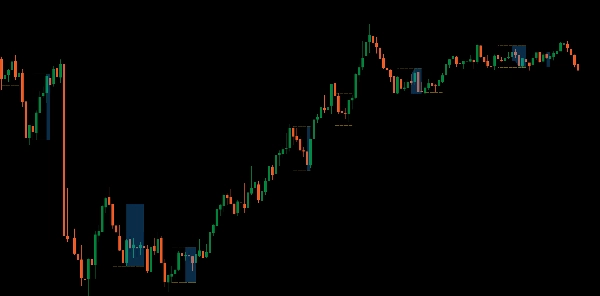
تقديم مؤشر مناطق التوحيد المصمم لمساعدتك على تحديد واستغلال فرص الاختراق بسهولة.
تسلط هذه الأداة القوية الضوء على المناطق في الرسم البياني حيث يتجمع السعر، مما يجعل من السهل تحديد نقاط الاختراق المحتملة. من خلال تصور هذه المناطق الحرجة، يمكنك التنبؤ بشكل أفضل بحركات السوق واتخاذ قرارات تداول أكثر وعيًا.
مثالي للمتداولين الذين يتطلعون إلى تعزيز استراتيجيتهم برؤى واضحة وقابلة للتنفيذ، قم بترقية مجموعة أدوات التداول الخاصة بك وتعلم كيفية السيطرة على الاختراقات باستخدام مؤشر مناطق التوحيد.
الملخص
ملخص الذكاء الاصطناعي
The Consolidation Zones indicator identifies and visualizes price consolidation areas on trading charts to help traders spot potential breakout points. By highlighting these zones, it assists in anticipating market movements and supports more informed decision-making. This tool is applicable across multiple markets, including Forex, cryptocurrencies (e.g., BTCUSD), commodities (e.g., gold, oil), indices (e.g., NAS100, SP500), and stocks. It is designed to enhance trading strategies focused on breakout opportunities by providing clear visual cues of consolidation phases.
ملف تعريف المؤشر
تقييمات العملاء
4.0
التقييمات: 1
5 | 0 % | |
4 | 100 % | |
3 | 0 % | |
2 | 0 % | |
1 | 0 % |
تقييمات العملاء
October 12, 2025
Two timeframes give more context, and the log becomes easier to read.
مناقشة
الأسئلة الشائعة
BTCUSD
Forex
Breakout
Indices
EURUSD
Commodities
GBPUSD
NZDUSD
Prop
Crypto
Stocks
XAUUSD
NAS100
USDJPY
يتم توفير المنتجات المتاحة من خلال cTrader Store، بما في ذلك روبوتات التداول والمؤشرات والإضافات، من قبل مطوري الطرف الثالث وإتاحتها لأغراض الوصول المعلوماتي والفني فقط. cTrader Store ليس وسيطًا ولا يقدم نصائح استثمارية أو توصيات شخصية أو أي ضمان للأداء المستقبلي.


السعر
منذ 25/09/2025
25
المبيعات
315
التثبيتات المجانية