
MACD Crossover PRO
مؤشر
3 عمليات الشراء
الإصدار 1.0، Oct 2025
Windows, Mac
5.0
التقييمات: 1
الوصف
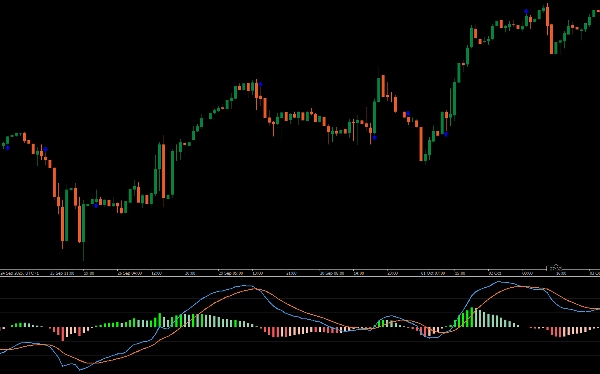
تقديم مؤشر MACD الكلاسيكي القابل للتخصيص، المصمم لتعزيز تجربتك في التداول بميزات مخصصة.
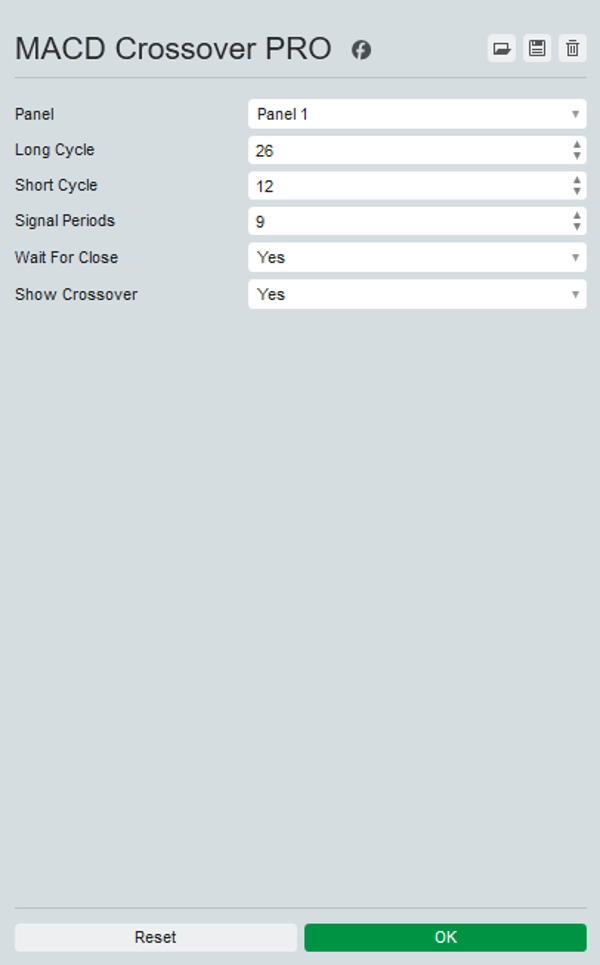
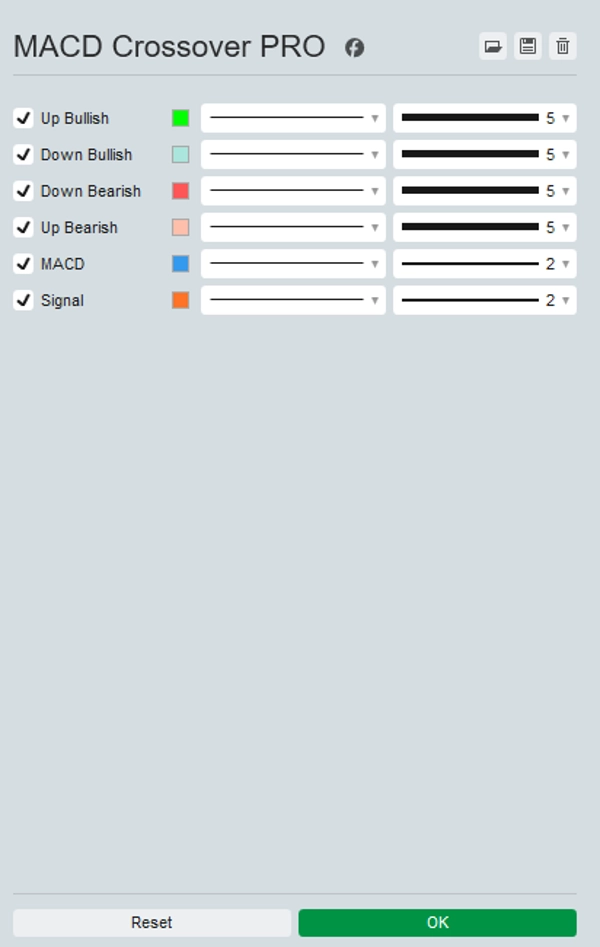
هذا الإصدار المطور من مؤشر MACD التقليدي يتيح لك تخصيص ألوان الخطوط والهيستوجرام لتصور أوضح للرسم البياني. اختياريًا، يمكنه التحديث في الوقت الحقيقي باستخدام بيانات التيك بدلاً من إغلاق الشمعة، مما يوفر رؤى فورية في الأسواق سريعة الحركة.
بالإضافة إلى ذلك، يبرز نقاط التقاطع مباشرة على الرسم البياني، مما يسهل اكتشاف إشارات الشراء والبيع المحتملة.
عزز استراتيجيتك في التداول باستخدام مؤشر MACD الكلاسيكي القابل للتخصيص لتحسين الدقة واتخاذ القرار.
الملخص
ملخص الذكاء الاصطناعي
MACD Crossover PRO is a customizable version of the classic MACD (Moving Average Convergence Divergence) indicator designed for enhanced trading analysis. It allows users to personalize the colors of the MACD lines and histogram for improved chart clarity. The indicator supports real-time updates based on tick data rather than waiting for candle closes, providing more immediate insights in fast-moving markets. It also visually highlights crossover points on the chart, aiding in the identification of potential buy and sell signals. This tool is applicable across various markets including Forex, cryptocurrencies, stocks, commodities, and indices, supporting symbols such as BTCUSD, EURUSD, GBPUSD, XAUUSD, NAS100, and USDJPY. The indicator is suited for traders employing strategies like scalping and signal-based entries, aiming to improve precision and decision-making through enhanced visualization and timely data updates.
ملف تعريف المؤشر
تقييمات العملاء
5.0
التقييمات: 1
5 | 100 % | |
4 | 0 % | |
3 | 0 % | |
2 | 0 % | |
1 | 0 % |
تقييمات العملاء
October 15, 2025
The first test should keep DD under 3 percent. The review process gets less scattered.
مناقشة
الأسئلة الشائعة
BTCUSD
Forex
Signal
Indices
EURUSD
Commodities
GBPUSD
NZDUSD
Prop
Scalping
Crypto
Stocks
XAUUSD
NAS100
MACD
USDJPY
يتم توفير المنتجات المتاحة من خلال cTrader Store، بما في ذلك روبوتات التداول والمؤشرات والإضافات، من قبل مطوري الطرف الثالث وإتاحتها لأغراض الوصول المعلوماتي والفني فقط. cTrader Store ليس وسيطًا ولا يقدم نصائح استثمارية أو توصيات شخصية أو أي ضمان للأداء المستقبلي.


السعر
منذ 25/09/2025
25
المبيعات
315
التثبيتات المجانية