
説明
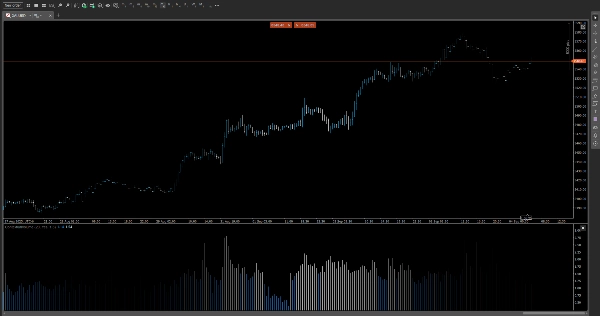
📊 相対出来高イントラデイ(RVI)
重要な出来高の急増を見逃さない—重要な時に。
RVIは、現在の出来高を同じ時間帯の過去平均と比較し、イントラデイセッション全体の隠れたモメンタムと流動性の変化を明らかにする精密に設計された指標です。
🔍 主な特徴
• 時間帯別出来高プロファイリング
過去のセッション全体で各時間帯(例:午前10時15分)の平均出来高を計算し、各ローソク足の文脈的なベンチマークを提供します。
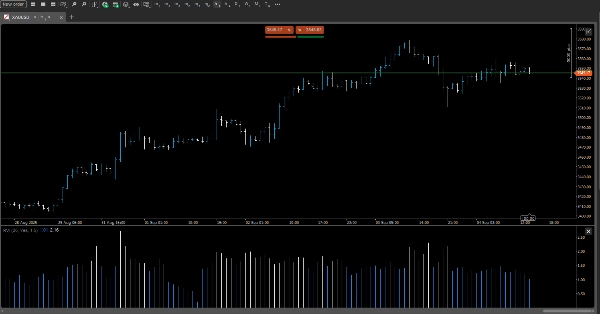
• マルチタイムフレーム対応
5分足 チャートから12時間 タイムフレームまでシームレスに機能し、スキャルピング、スイング、セッションベースの取引スタイルに適応します。
• 動的カラーコーディング
カスタマイズ可能な色の閾値を使用して、平均以上の出来高のローソク足を強調表示します。直感的な視覚的手がかりで高活動ゾーンを即座に識別できます。
• 比率モードと差分モード
お好みの指標を選択してください:
• 比率モード: 現在の出来高 ÷ 平均出来高を表示(例:2.3×)
• 差分モード:絶対偏差を表示(例:+1,200契約)
• オーバーレイまたはパネル表示
インラインチャートのオーバーレイとコンパクトなサイドパネルを切り替えて、既存のレイアウトにすっきりと統合できます。
🎯 使用例
• 典型的な活動に対する出来高の急増でブレイクアウトの強さを確認
• 出来高が低い期間の誤信号をフィルタリング
• 重要なイントラデイ時間帯での機関投資家の足跡を特定
• 時間を考慮した文脈で出来高ベースの戦略を強化
⚙️ カスタマイズオプション
• 過去平均のための調整可能な遡及期間
• 出来高強度のためのユーザー定義の色閾値
• 表示モードの切り替え(比率/差分)
• ダーク/ライトテーマ対応
概要
カスタマーレビュー
5 | 100 % | |
4 | 0 % | |
3 | 0 % | |
2 | 0 % | |
1 | 0 % |


