
説明
前日の予測レベル
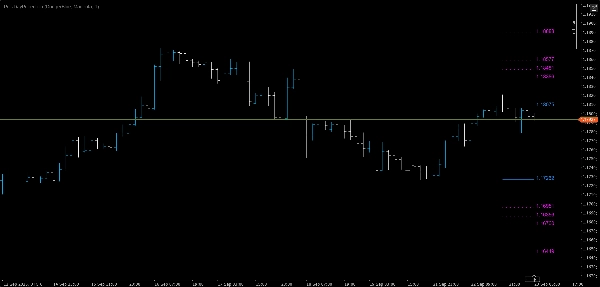
昨日の価格動向に基づく動的なフィボナッチ予測で精密な取引を実現。
このインジケーターは自動的に前日の高値と安値を計算し、レンジを決定した後、そのレンジの上下にフィボナッチレベルを投影します。これにより、潜在的なサポート、レジスタンス、ブレイクアウトゾーンの即時参照ポイントを提供します。
主な特徴
- 📅 前日の高値・安値の自動検出
- 📏 レンジに基づくフィボナッチ予測(38.2%、50%、61.8%、100%レベル)
- 🔼 前回高値の上方:強気の継続ターゲットのための4つのフィボナッチレベル
- 🔽 前回安値の下方:弱気の継続ターゲットのための4つのフィボナッチレベル
- 🎯 今日の最初のバーから始まるセグメントのみのライン— チャート上の混雑なし
- 🏷 右端の価格ラベルで素早く一目で参照可能
- 🎨 カスタマイズ可能な色と線の太さでチャートスタイルに合わせられます
トレーダーに愛される理由
- 明確な日中のロードマップ:セッション開始前に重要なレベルを正確に把握できます。
- 双方向の分析:上昇と下降の両方の動きを計画できます。
- 時間節約の自動化:手動での描画や再計算は不要です。
- あらゆる時間枠で機能:スキャルピングからスイングトレードまで対応。
こんな方に最適
- 正確なブレイクアウトターゲットを求めるデイトレーダー
- 重要なリトレースメントゾーンを特定するスイングトレーダー
- 戦略の一部としてフィボナッチレベルを使用するすべての人
💡 ヒント: このインジケーターをお気に入りのモメンタムやボリュームツールと組み合わせて、これらの予測レベル周辺でのエントリーとエグジットを確認しましょう。
概要
AIによる概要
PrevDayProjection is a technical indicator designed for trading platforms that automatically calculates the previous trading day’s high and low prices, determines the range, and projects Fibonacci levels based on that range. It generates key Fibonacci retracement and extension levels at 38.2%, 50%, 61.8%, and 100% both above the previous high and below the previous low. These levels serve as potential support, resistance, and breakout zones.
The indicator displays segment-only lines starting from the current day’s first bar to avoid chart clutter and includes price labels at the right edge for quick reference. Users can customize colors and line thickness to fit their chart style. It supports any timeframe, making it suitable for scalping, day trading, and swing trading.
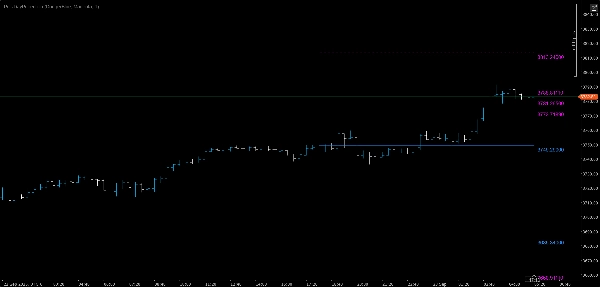
PrevDayProjection is applicable across multiple markets including Forex, Indices, Commodities, and Crypto, with specific tags indicating symbols like EURUSD, XAUUSD (gold), and NAS100. It provides traders with a clear intraday roadmap and dual-direction analysis to plan for both bullish and bearish moves. The tool automates manual calculations, saving time and enhancing precision in identifying breakout targets and retracement zones.
The indicator displays segment-only lines starting from the current day’s first bar to avoid chart clutter and includes price labels at the right edge for quick reference. Users can customize colors and line thickness to fit their chart style. It supports any timeframe, making it suitable for scalping, day trading, and swing trading.
PrevDayProjection is applicable across multiple markets including Forex, Indices, Commodities, and Crypto, with specific tags indicating symbols like EURUSD, XAUUSD (gold), and NAS100. It provides traders with a clear intraday roadmap and dual-direction analysis to plan for both bullish and bearish moves. The tool automates manual calculations, saving time and enhancing precision in identifying breakout targets and retracement zones.
インジケーターのプロフィール
カスタマーレビュー
0.0
レビュー: 0
カスタマーレビュー
この商品にはまだレビューがありません。お使いになったことがある方は、ぜひレビューをお願いします。
ディスカッション
よくあるご質問
Forex
Indices
EURUSD
Commodities
Crypto
XAUUSD
NAS100
cTrader Storeで入手可能な取引ボット、インジケーター、プラグインなどの商品は、第三者の開発者が提供するものであり、情報と技術の取得のみを目的としてご利用いただけます。cTrader Storeはブローカーではなく、投資助言や個人的な推奨を行うことも、将来のパフォーマンスを保証することもありません。


これも好きかも

![「High-Low Divergence [Iridio Capital]」ロゴ](https://cdn.ctrader.com/image/webp/443c4661-7abb-40f1-842f-4b6ec560649b_40914)


価格
26
販売
2.14K
無料インストール