
RT Stochastic RSI PRO
อินดิเคเตอร์
1 การซื้อ
เวอร์ชัน 1.0, Sep 2024
Windows, Mac
คำอธิบาย
แนะนำ Stochastic RSI PRO สำหรับ cTrader รุ่นขั้นสูงของ Stochastic RSI ตัวชี้วัดที่ออกแบบมาเพื่อเพิ่มความแม่นยำในการเทรดของคุณ
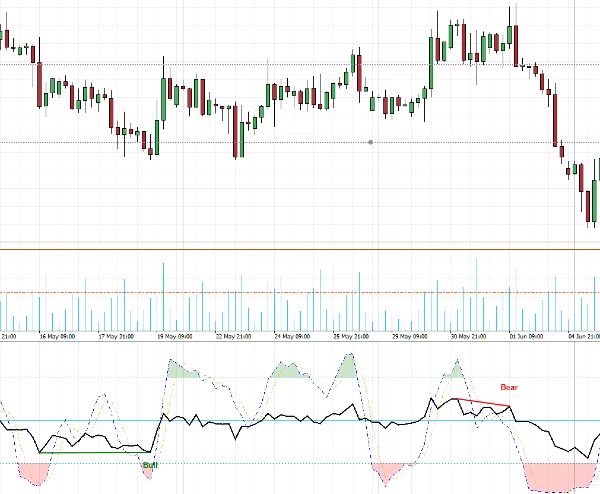
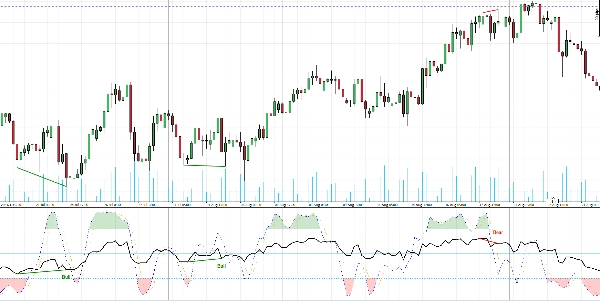
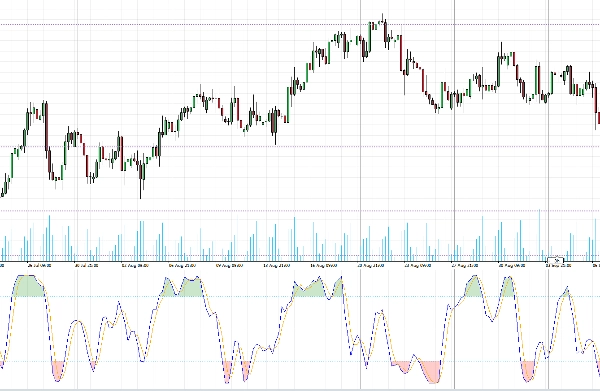
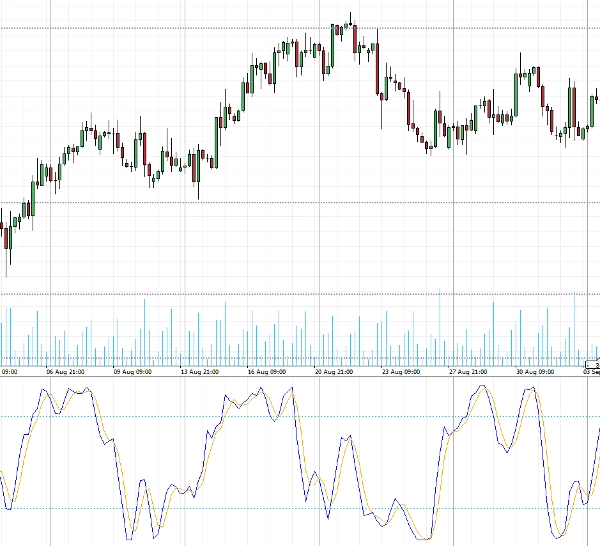
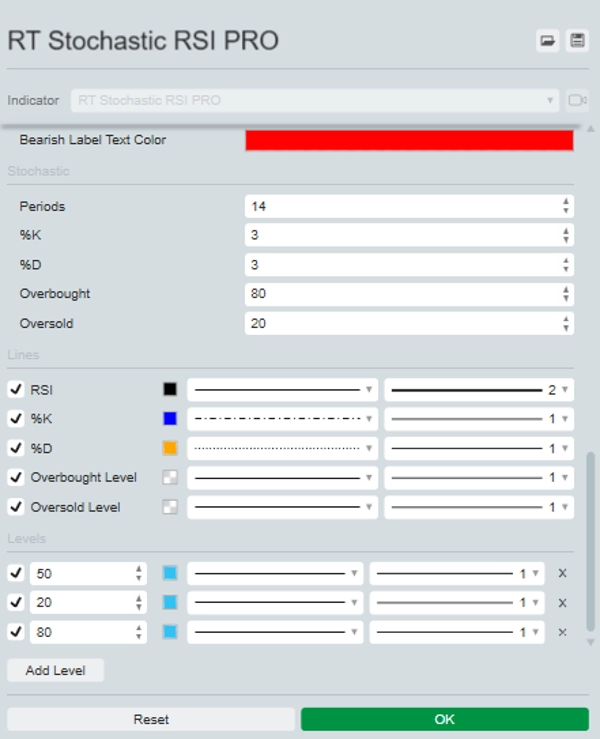
เครื่องมือทรงพลังนี้จะซ้อน RSI โดยตรงบน Stochastic RSI เพื่อให้มุมมองที่ครอบคลุมเกี่ยวกับโมเมนตัมของตลาด มันเน้นพื้นที่ที่ซื้อเกินและขายเกินด้วยสีที่แตกต่างกันเพื่อการระบุที่ง่ายดาย
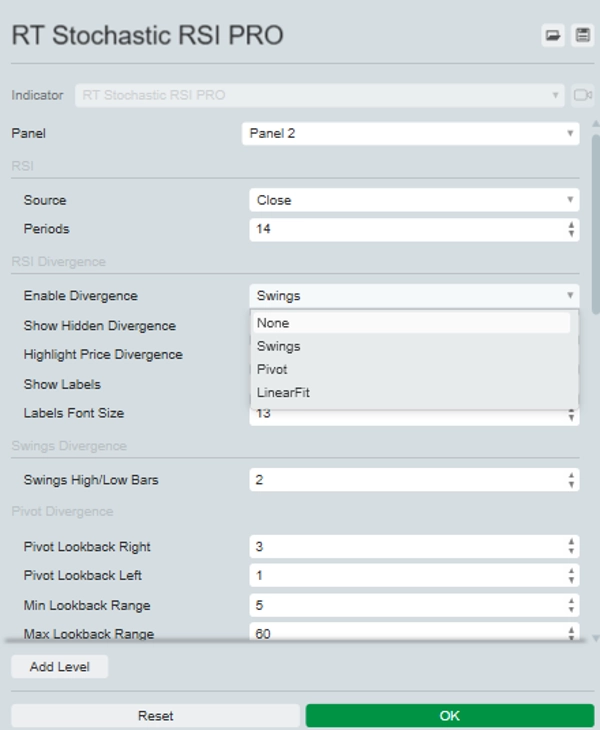
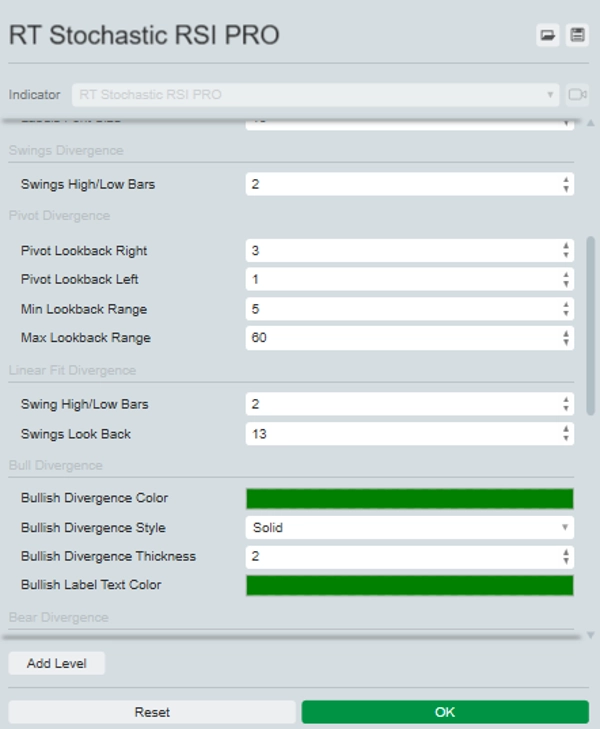
คุณสมบัติเด่นของ Stochastic RSI PRO คือความสามารถในการระบุและเน้นทั้ง divergences ปกติและซ่อนเร้นบนกราฟ คุณสามารถเลือกจากสามวิธีในการระบุ divergences: Swing, Pivot หรือ Linear Fit แต่ละวิธีมีการตั้งค่าที่ปรับแต่งได้เพื่อให้ตรงกับกลยุทธ์การเทรดของคุณ
ยกระดับการวิเคราะห์และการตัดสินใจของคุณด้วย Stochastic RSI PRO เครื่องมือที่จำเป็นสำหรับนักเทรดที่มีวิจารณญาณ
สรุป
โปรไฟล์อินดิเคเตอร์
รีวิวจากลูกค้า
0.0
รีวิว: 0
รีวิวจากลูกค้า
ยังไม่มีรีวิวสำหรับผลิตภัณฑ์นี้ หากเคยลองแล้ว ขอเชิญมาเป็นคนแรกที่บอกคนอื่น!
การสนทนา
คำถามที่พบบ่อย
BTCUSD
Forex
Signal
Scalping
Indices
EURUSD
Commodities
GBPUSD
RSI
Crypto
Stocks
XAUUSD
ผลิตภัณฑ์ที่มีให้บริการผ่าน cTrader Store รวมถึงบอทการเทรด อินดิเคเตอร์ และปลั๊กอิน มีให้บริการโดยนักพัฒนาบุคคลที่สามและมีไว้เพื่อวัตถุประสงค์ในการเข้าถึงข้อมูลและทางเทคนิคเท่านั้น cTrader Store ไม่ใช่โบรกเกอร์และไม่ได้ให้คำแนะนำการลงทุน คำแนะนำส่วนบุคคล หรือการรับประกันผลการดำเนินงานในอนาคต


ราคา
ตั้งแต่ 25/09/2024
20
การขาย