
Half Trend BT
Gösterge
38 satın almalar
Sürüm 1.0, Mar 2025
Windows, Mac
4.3
Değerlendirmeler: 3
Açıklama
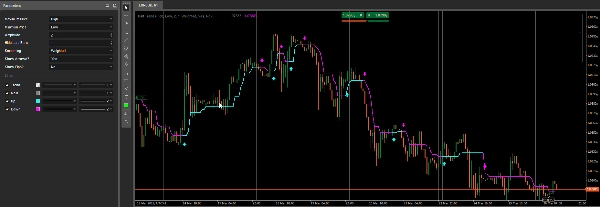
Half Trend göstergesi, belirli bir dönem boyunca son yüksek ve düşükleri karşılaştırarak potansiyel trend dönüşlerini tespit etmek ve vurgulamak için tasarlanmıştır, ardından buna göre “Yukarı” veya “Aşağı” çizgisi çizer. İsteğe bağlı olarak her trend değişiminde oklar çizer ve sinyaller arasındaki pip farklarını gösterebilir.
- Yüksek/Düşük Seri Seçimi
- Gösterge, yerel maksimum ve minimumları takip etmek için iki fiyat serisi (varsayılan olarak Yüksek ve Düşük) kullanır.
- Her seri için farklı fiyat türleri seçebilirsiniz (örneğin,
Açılış,Kapanış,Medyanvb.) Maksimum Fiyat ve Minimum Fiyat aracılığıyla.
- Hareketli Ortalamalar ve Dönem Hesaplaması
- Seçilen Yumuşatma türü ve Genlik dönemi temel alınarak, seçilen “yüksek” ve “düşük” fiyat serilerine hareketli ortalama uygulanır.
- Gösterge, mevcut bar fiyatlarını bu yumuşatılmış yüksek/düşük seviyelerle karşılaştırarak yukarı trendden aşağı trende (veya tam tersine) geçilip geçilmeyeceğine karar verir.
- Trend Tespiti ve Çizimi
- Gösterge bir yukarı trend tespit ederse, Yukarı çizgisini (camgöbeği) çizer ve
Trenddeğerini+1olarak ayarlar. - Aşağı trend tespit ederse, Aşağı çizgisini (macenta) çizer ve
Trenddeğerini-1olarak ayarlar. - Ana çıktı (gri) mevcut destek/direnç seviyelerini yansıtacak şekilde dahili olarak güncellenir.
Trend, trend yönünü sayısal olarak saklayan görünmez bir çıktı serisidir (+1veya-1).
- Gösterge bir yukarı trend tespit ederse, Yukarı çizgisini (camgöbeği) çizer ve
- Oklar ve Pip Hesaplaması
- Okları Göster? – Etkinleştirilirse, gösterge her yeni barda bir trend dönüşü tespit edildiğinde bir ok çizer.
- Pipleri Göster? – Etkinleştirilirse, son sinyal ile yeni sinyal arasındaki pip farkını hesaplar ve gösterir, grafikte küçük bir etiket ve trend çizgisi çizer.
Özet
YZ özeti
The Half Trend BT indicator detects potential trend reversals by analyzing recent highs and lows over a specified period. It compares two selected price series—typically High and Low, but configurable to other price types such as Open, Close, or Median—using moving averages based on chosen smoothing methods and amplitude periods. The indicator plots an "Up" line (cyan) when an uptrend is detected and a "Down" line (magenta) for a downtrend, while internally storing trend direction numerically (+1 or -1). A main output line (gray) reflects current support and resistance levels. Optional features include drawing arrows on bars where trend reversals occur and calculating pip differences between signals, which are displayed as labels and trendlines on the chart. This indicator supports multiple markets including Forex, indices, commodities, cryptocurrencies, and stocks.
Gösterge profili
Müşteri değerlendirmeleri
4.3
Değerlendirmeler: 3
5 | 33 % | |
4 | 67 % | |
3 | 0 % | |
2 | 0 % | |
1 | 0 % |
Müşteri değerlendirmeleri
March 29, 2025
Clean idea for traders around chart reading. The useful part is adding confirmation before a trade, with the numbers checked before scaling. The cleaner reads should hold across 3 sessions, not just 1 good chart. It is stronger when a 1.5R target is realistic before the entry.
March 28, 2025
March 28, 2025
Decent tool for testing if the trader wants it makes market context easier to scan. It works best as support, not a final decision maker. I would test it on 2 timeframes, 20 signals and a 1R stop plan. it should not be used as a blind entry trigger.
Tartışma
SSS
Prop
Forex
Signal
Indices
Commodities
Crypto
Stocks
cTrader Store üzerinden erişilebilen işlem botları, göstergeler ve eklentiler gibi ürünler, üçüncü taraf sağlayıcılar tarafından sağlanır ve yalnızca bilgilendirme ve teknik erişim amaçlarıyla sunulur. cTrader Store bir broker değildir ve yatırım tavsiyesi, kişisel öneriler vermez veya gelecekteki performansı garanti etmez.


Fiyat
48
Satışlar
1.06K
Ücretsiz yüklemeler