
คำอธิบาย
Camarilla โดย Bullitt Traders — มองเห็นโครงสร้าง เทรดอย่างแม่นยำ
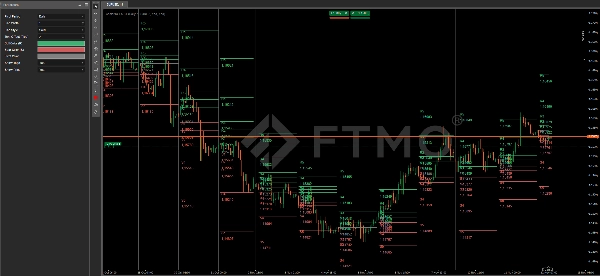
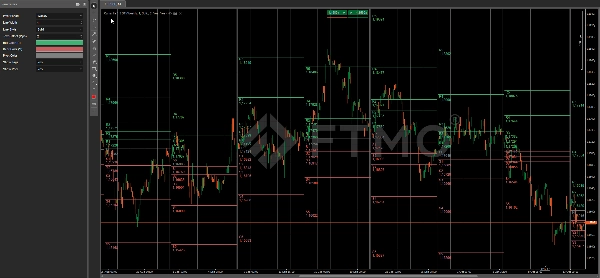
ตัวบ่งชี้ Camarilla pivot ระดับมืออาชีพสำหรับ cTrader สร้างขึ้นเพื่อแสดงให้เห็นว่าราคาตอบสนองอย่างไรรอบระดับสถาบัน
มันจะวางระดับ Camarilla สำคัญทั้งหมด (R1–R5 / S1–S5) และจุด pivot ในหลายกรอบเวลาโดยอัตโนมัติ — ให้แผนที่โครงสร้างที่ชัดเจนสำหรับการกลับตัวและการเบรกเอาต์แก่เทรดเดอร์
คุณสมบัติหลัก
- ✅ สูตร Camarilla แท้จริง — คำนวณระดับจากราคาสูง ต่ำ และปิดของช่วงเวลาก่อนหน้า
- 📊 ตรรกะหลายกรอบเวลา — เลือกระหว่างช่วงเวลาพิวอตรายวัน รายสัปดาห์ หรือรายเดือน
- 🕒 การทำแผนที่ประวัติศาสตร์ — วาดช่วงเวลาก่อนหน้าโดยอัตโนมัติสำหรับบริบทภาพและการวิเคราะห์โครงสร้าง
- 🎨 การปรับแต่งสไตล์ — ปรับความกว้างเส้น สไตล์ และสีตามโหมด (ขาขึ้น ขาลง เป็นกลาง)
- 💬 ป้ายชื่อ & ราคา — สลับการแสดงข้อความและค่าราคาเพื่อเลย์เอาต์ที่สะอาดหรือรายละเอียด
- ⚡ น้ำหนักเบา & ไม่รีเพนท์ — ปรับแต่งเพื่อความเร็วและความแม่นยำบนสัญลักษณ์ใดก็ได้
- 🧩 ใช้งานได้กับทุกประเภทแผนภูมิ — รองรับเวลา ช่วง ราคา tick และ Renko
ระดับ Camarilla
R5 – โซนเป้าหมายเบรกเอาต์สุดขีด
R4 – แนวต้านหลัก จุดกระตุ้นเบรกเอาต์ที่เป็นไปได้
R3 – โซนกลับตัวด้านบน มักใช้สำหรับการเข้าซื้อขายสั้น
R2 – แนวต้านระดับกลาง
R1 – แนวต้านเริ่มต้น ระดับปฏิกิริยาแรก
PP – จุด pivot กลาง (โซนกลับตัวเฉลี่ย)
S1 – แนวรับเริ่มต้น ระดับปฏิกิริยาแรก
S2 – แนวรับระดับกลาง
S3 – โซนกลับตัวด้านล่าง มักใช้สำหรับการเข้าซื้อขายยาว
S4 – แนวรับหลัก จุดกระตุ้นเบรกเอาต์ที่เป็นไปได้
S5 – โซนเป้าหมายเบรกเอาต์สุดขีด
พารามิเตอร์
ช่วงเวลาพิวอต – เลือก รายวัน รายสัปดาห์ หรือรายเดือน สำหรับการคำนวณระดับ
ความกว้างเส้น – ปรับความหนาเส้นโดยรวม
สไตล์เส้น – ตั้งค่าเป็น เส้นทึบ จุด หรือ ขีด
ระยะห่างข้อความ (Pips) – ระยะห่างระหว่างเส้นกับป้ายชื่อ
สีขาขึ้น (R) – สีสำหรับระดับแนวต้าน (R1–R5)
สีขาลง (S) – สีสำหรับระดับแนวรับ (S1–S5)
สีพิวอต – สีสำหรับเส้น pivot กลาง (PP)
แสดงแท็ก – แสดงหรือซ่อนชื่อระดับ R/S
แสดงราคา – แสดงหรือซ่อนป้ายราคาตัวเลข
วิธีใช้
โซน R3–S3 → พื้นที่กลับตัวภายในวันทั่วไป
ระดับ R4–S4 → การยืนยันเบรกเอาต์หรือการต่อเนื่อง
R5–S5 → เป้าหมายความผันผวนสูงและโซนหมดแรง
สรุป
Key features include automatic plotting of historical pivot levels for context, customizable line width, style, and colors for bullish, bearish, and neutral regimes, and options to show or hide level labels and price values. The indicator is lightweight, non-repainting, and compatible with various chart types such as time, range, tick, and Renko charts.
Camarilla levels serve specific roles: R3–S3 zones indicate typical intraday reversal areas; R4–S4 levels suggest breakout or continuation confirmations; and R5–S5 mark extreme breakout targets and high-volatility exhaustion zones. This tool provides a clear structural map to assist traders in identifying potential reversals, breakouts, and target zones across multiple markets including Forex, indices, commodities, cryptocurrencies, and stocks.
รีวิวจากลูกค้า
5 | 100 % | |
4 | 0 % | |
3 | 0 % | |
2 | 0 % | |
1 | 0 % |


!["[Hamster-Coder] Pivot Points MTF" โลโก้](https://cdn.ctrader.com/image/webp/4c143e5a-309c-40e3-a578-f04d1e133ffa_31159)


