
คำอธิบาย
💡 ช่องทางการถดถอยเชิงเส้นและจุด ZigZag 💡
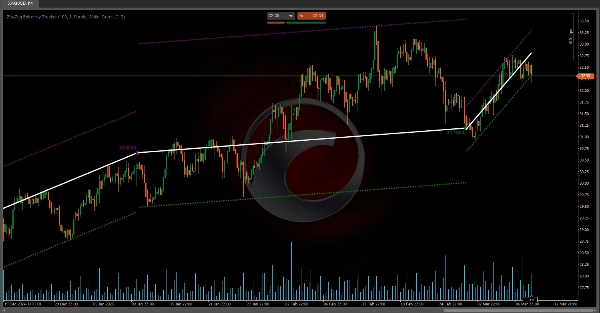
• ช่องทางการถดถอยเชิงเส้น จะถูกคำนวณใหม่และรีเซ็ตทุกครั้งที่ราคาขยับเกินขอบเขตที่คาดไว้ (แถบ) เพื่อให้การวัดยังคงเป็นปัจจุบันกับแนวโน้มจริงของตลาด
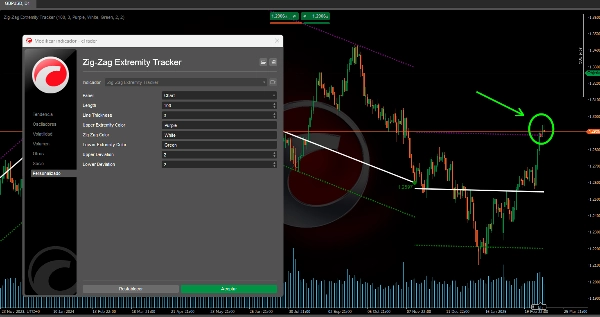
• จุดที่ทำเครื่องหมาย (วงกลม) แสดงถึงจุดสุดขีด (สูงสุดและต่ำสุด) ที่ใช้เป็นฐานในการวาด ZigZag และกำหนดตำแหน่งที่คำนวณช่องทาง
• วิธีการแบบไดนามิกนี้ ช่วยให้เห็นภาพการเปลี่ยนแปลงแนวโน้มที่อาจเกิดขึ้นได้ดีขึ้น รวมถึงพื้นที่ที่มีการขยายตัวหรือขายเกินไปที่ราคาน่าจะกลับเข้าสู่ค่าเฉลี่ย
❓ ช่องทางเหล่านี้เกี่ยวข้องกับ ZigZag และจุดสุดขีดอย่างไร? ❓
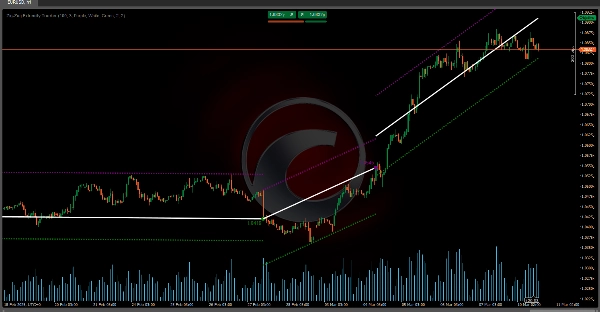
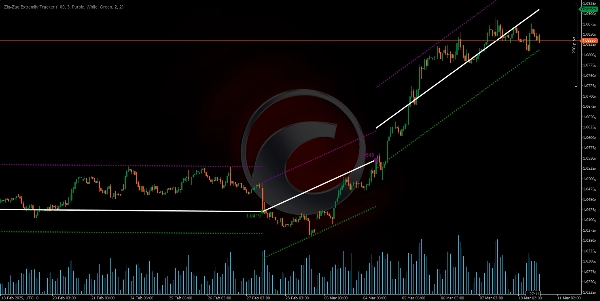
• ทุกครั้งที่ตรวจพบจุดสุดขีดใหม่ (สูงหรือต่ำ) ตัวบ่งชี้จะไม่เพียงแต่แสดงวงกลมและเส้น ZigZag ที่เชื่อมจุดนั้นกับจุดก่อนหน้าเท่านั้น แต่ยังปรับช่องทางการถดถอยเชิงเส้นที่อาจเกิดขึ้นใหม่จากจุดสุดขีดล่าสุดนั้นด้วย
• หากในช่วงแท่งถัดไป ราคายังคงอยู่ภายในแถบ ช่องทางจะยังคงใช้งานได้และขยายไปถึงแท่งปัจจุบัน
• หากในช่วงใดราคาทะลุแถบนั้น ตัวบ่งชี้จะ “สมมติ” ว่าช่องทางนั้นถูกยกเลิกและเริ่มช่องทางใหม่จากแท่งที่เกิดการทะลุนั้น
ตัวบ่งชี้ร้านค้า Ctrader:
โครงสร้างตลาดแบบไดนามิก
การวิเคราะห์จุดเปลี่ยน
ฟีโบนักชีเชิงเส้น
การถดถอยหลายกรอบเวลา
ช่วงช่องว่างมูลค่ายุติธรรมโมเมนตัม
ตัวติดตามความลำเอียงแท่งเทียนหลายระดับ
Tracker
เส้นแนวโน้มสนับสนุนและ
แนวต้านอัตโนมัติ
ระดับสนับสนุนและ
แนวต้านทั้งหมด
การวิเคราะห์โครงสร้างตลาดแบบไดนามิกของจุดเปลี่ยน
ฟีโบนักชีเชิงเส้นถดถอยหลายกรอบเวลา
ตัวติดตามความลำเอียงแท่งเทียนหลายระดับ
เส้นแนวโน้มสนับสนุนและแนวต้านอัตโนมัติ
สรุป
รีวิวจากลูกค้า
5 | 50 % | |
4 | 50 % | |
3 | 0 % | |
2 | 0 % | |
1 | 0 % |


