
คำอธิบาย
ตัวชี้วัด Pinescriptlabs Store: Pinescriptlabs Store cBots : (cBot) Gold & BTC BreakoutSession Pivots(ใหม่)
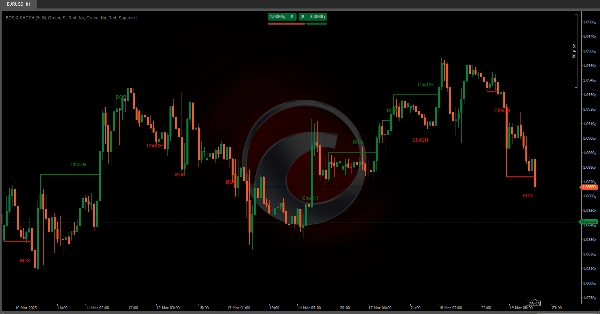
โครงสร้างตลาดขั้นสูง: Bos, Choch, SwinLevels, Order Blocks, Market Structure & Liquidity Finder (ใหม่)
การคาดการณ์สภาพคล่องราคา ZigZag
อัลกอริทึมสมาร์ทติดตาม (ใหม่)
แผนที่การชำระบัญชีด้วยเลเวอเรจ
SmartTrend การสนับสนุน &
แนวต้าน
เส้น
ช่องว่างมูลค่ายุติธรรมในช่วงเวลา
การวิเคราะห์
โครงสร้างตลาด
แบบไดนามิก
ของ
จุดเปลี่ยน
Points
ฟีโบนักชี
การถดถอยเชิงเส้น
หลายกรอบเวลา
Multi-timeframe
ช่องว่างมูลค่ายุติธรรมโมเมนตัม
ตัวติดตาม
แนวโน้มแท่งเทียนหลายระดับ
Tracker
แนวโน้ม
แนวรับและ
แนวต้าน
เส้น
ระดับ
แนวรับและ
แนวต้านทั้งหมด
Levels
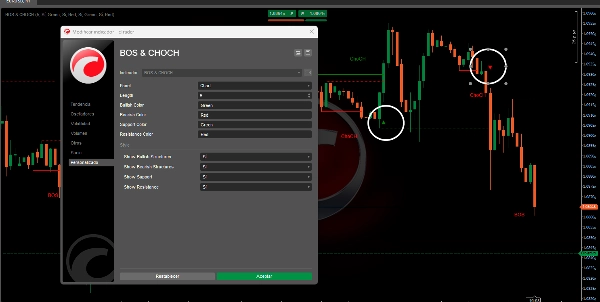
อัลกอริทึมนี้ออกแบบมาเพื่อระบุ รูปแบบโครงสร้างตลาด โดยเฉพาะแนวคิดของ การเปลี่ยนแปลงลักษณะ (ChoCH) 🔄 และ การทำลายโครงสร้าง (BoS) 💥 ด้านล่างนี้ ฉันจะอธิบายอย่างละเอียดว่าอัลกอริทึมนี้ทำอะไร จุดประสงค์ของมัน และวิธีที่มันระบุแนวคิดทั้งสองนี้
อัลกอริทึมทำอะไร?
อัลกอริทึมใช้ แฟรคทัล (จุดสูงและต่ำในท้องถิ่น) เพื่อกำหนดว่าราคามีการเปลี่ยนแปลงพฤติกรรมหรือทำลายโครงสร้างที่ตั้งไว้ก่อนหน้านี้หรือไม่ ด้านล่างนี้คือฟังก์ชันหลัก:
การตรวจจับแฟรคทัล 📊
- แฟรคทัลขาขึ้น เกิดขึ้นเมื่อมีจุดสูงในท้องถิ่นที่แท่งเทียนทั้งสองข้างต่ำกว่า 📈
- แฟรคทัลขาลง เกิดขึ้นเมื่อมีจุดต่ำในท้องถิ่นที่แท่งเทียนทั้งสองข้างสูงกว่า 📉
- แฟรคทัลเหล่านี้ทำหน้าที่เป็นจุดอ้างอิงสำหรับการระบุการเปลี่ยนแปลงในโครงสร้างตลาด
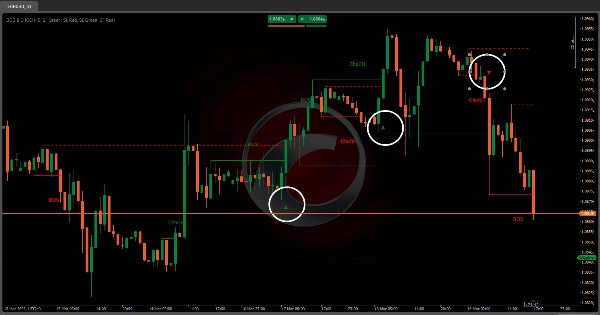
การระบุ ChoCH (การเปลี่ยนแปลงลักษณะ) 🔄
- ChoCH ขาขึ้น เกิดขึ้นเมื่อราคาผ่านแฟรคทัลขาขึ้นโดยไม่สร้างโครงสร้างขาลงสมบูรณ์ก่อนหน้า
- ChoCH ขาลง เกิดขึ้นเมื่อราคาต่ำกว่าจุดแฟรคทัลขาลงโดยไม่สร้างโครงสร้างขาขึ้นสมบูรณ์ก่อนหน้า
- นี่แสดงให้เห็นว่าตลาดได้เปลี่ยนลักษณะของมัน (จากแนวโน้มหรือการรวมตัวกัน หรือในทางกลับกัน)
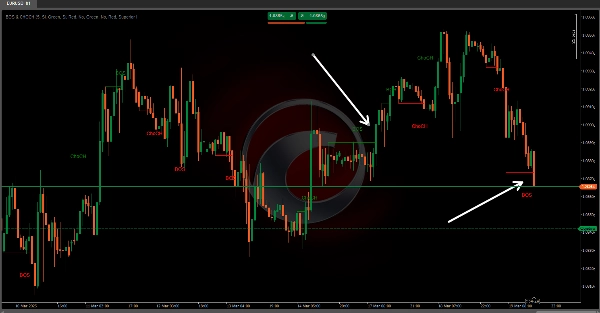
การระบุ BoS (การทำลายโครงสร้าง) 💥
- BoS ขาขึ้น เกิดขึ้นเมื่อราคาผ่านแฟรคทัลขาขึ้นหลังจากสร้างโครงสร้างขาลงสมบูรณ์ก่อนหน้า
- BoS ขาลง เกิดขึ้นเมื่อราคาต่ำกว่าจุดแฟรคทัลขาลงหลังจากสร้างโครงสร้างขาขึ้นสมบูรณ์ก่อนหน้า
- นี่แสดงให้เห็นว่าตลาดได้ทำลายโครงสร้างที่ตั้งไว้ก่อนหน้านี้ ซึ่งอาจเป็นจุดเข้าออกที่สำคัญ
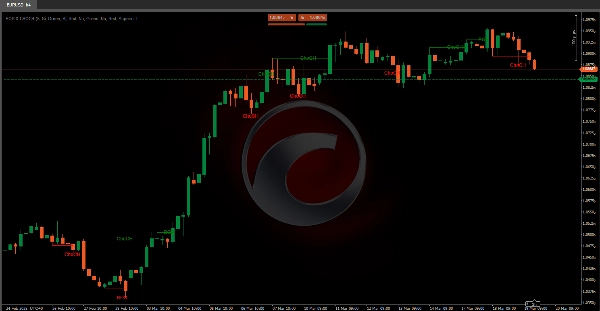
การแสดงภาพแนวรับและแนวต้าน 🛡️
- อัลกอริทึมสามารถวาด เส้นแนวรับและแนวต้าน ตามแฟรคทัลที่ตรวจพบ
- นอกจากนี้ยังตรวจสอบว่าเส้นเหล่านี้ถูกทำลายหรือไม่ โดยทำเครื่องหมายจุดเบรกเอาต์ด้วยไอคอนภาพ
อัลกอริทึมนี้ให้ข้อมูลเชิงลึกที่มีค่าสำหรับผู้ค้าเกี่ยวกับพฤติกรรมตลาดโดยการระบุการเปลี่ยนแปลงโครงสร้างหลักและโอกาสเบรกเอาต์ที่เป็นไปได้อย่างชัดเจน โดยใช้ ChoCH 🔄 และ BoS 💥 สัญญาณ ผู้ค้าสามารถตัดสินใจได้อย่างมีข้อมูลมากขึ้นเกี่ยวกับการเข้าออกและพลวัตตลาดโดยรวม
สรุป
Key functionalities include:
- **Fractal Detection:** Identifies bullish fractals (local highs with lower candles on both sides) and bearish fractals (local lows with higher candles on both sides).
- **Change of Character (ChoCH):** Signals when the market changes its behavior, such as shifting from trend to consolidation, by surpassing fractals without forming a complete opposite structure.
- **Break of Structure (BoS):** Indicates when the market breaks a previously established structure, marking potential entry or exit points.
- **Support and Resistance Visualization:** Draws support and resistance lines based on fractals and marks breakout points with visual icons.
This indicator aids traders in understanding market dynamics by clearly highlighting structural changes and breakout opportunities, supporting more informed trading decisions.
รีวิวจากลูกค้า
5 | 100 % | |
4 | 0 % | |
3 | 0 % | |
2 | 0 % | |
1 | 0 % |


