
MTF Candle Countdown
อินดิเคเตอร์
3 การซื้อ
เวอร์ชัน 1.0, Feb 2025
Windows, Mac
4.5
รีวิว: 2
คำอธิบาย
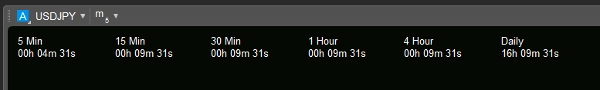
ตัวดัชนีนับถอยหลังปิดแท่งเทียน ช่วยให้นักเทรดเตรียมพร้อมโดยแสดงการนับถอยหลังแบบเรียลไทม์สำหรับการปิดของกรอบเวลาหลัก: 5 นาที, 15 นาที, 30 นาที, 1 ชั่วโมง, 4 ชั่วโมง และแท่งเทียนรายวัน เครื่องมือนี้ช่วยให้คุณไม่พลาดช่วงเวลาสำคัญของการเคลื่อนไหวราคา ช่วยในการจับเวลาการเทรดและการดำเนินกลยุทธ์อย่างแม่นยำ ควบคุมสถานการณ์และตัดสินใจอย่างมีข้อมูลด้วยการมองเห็นที่ชัดเจนว่าแท่งเทียนถัดไปจะก่อตัวเมื่อใด!
สรุป
สรุปโดย AI
The MTF Candle Countdown indicator provides a real-time countdown to the close of key candle timeframes including 5-minute, 15-minute, 30-minute, 1-hour, 4-hour, and daily intervals. By displaying the remaining time until the next candle forms, it assists traders in precise trade timing and strategy execution. This tool supports better decision-making by clearly indicating when significant price action moments will occur across multiple major timeframes. It is designed for use on bar-based charts and offers visual countdown information to help traders stay prepared for market changes.
โปรไฟล์อินดิเคเตอร์
หมวดหมู่อินดิเคเตอร์
ปริมาณ
ประเภทเอาต์พุต
การแสดงเป็นภาพ
ข้อกำหนดด้านข้อมูล
แท่งเท่านั้น
สัญญาณที่รองรับ
Breakout
ความแข็งแกร่งของแนวโน้ม
Range ณ เวลาที่เปิดเซสชัน
รีวิวจากลูกค้า
4.5
รีวิว: 2
5 | 50 % | |
4 | 50 % | |
3 | 0 % | |
2 | 0 % | |
1 | 0 % |
รีวิวจากลูกค้า
February 19, 2025
Not perfect, but the workflow felt cleaner. 20 signals gives enough for a first read.
การสนทนา
คำถามที่พบบ่อย
MSS
BOS
CHOCH
Moving Average
ผลิตภัณฑ์ที่มีให้บริการผ่าน cTrader Store รวมถึงบอทการเทรด อินดิเคเตอร์ และปลั๊กอิน มีให้บริการโดยนักพัฒนาบุคคลที่สามและมีไว้เพื่อวัตถุประสงค์ในการเข้าถึงข้อมูลและทางเทคนิคเท่านั้น cTrader Store ไม่ใช่โบรกเกอร์และไม่ได้ให้คำแนะนำการลงทุน คำแนะนำส่วนบุคคล หรือการรับประกันผลการดำเนินงานในอนาคต


ราคา
ตั้งแต่ 14/01/2025
55
การขาย
11.36K
ติดตั้งฟรี