
Supply Demand - BasicV1
อินดิเคเตอร์
1.27K ดาวน์โหลด
เวอร์ชัน 1.0, Feb 2025
Windows, Mac
5.0
รีวิว: 3
คำอธิบาย
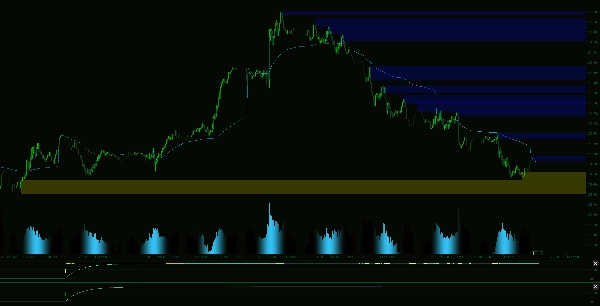
ระบุโซนการซื้อขายที่มีความน่าจะเป็นสูงอย่างแม่นยำ
เบื่อกับการวาดโซนอุปทานและอุปสงค์ด้วยตนเองหรือไม่? ตัวบ่งชี้ขั้นสูงนี้จะทำงานทั้งหมดให้คุณ โดยระบุพื้นที่สำคัญของตลาดที่ราคามีแนวโน้มจะกลับตัวหรือรวมตัว ออกแบบมาสำหรับเทรดเดอร์ที่จริงจัง เครื่องมือนี้ช่วยให้คุณเทรดด้วยความมั่นใจโดยเน้นโซนที่เกี่ยวข้องมากที่สุดแบบเรียลไทม์
คุณสมบัติหลัก:
สรุป
สรุปโดย AI
Supply Demand - BasicV1 is an advanced trading indicator designed to automatically identify key supply and demand zones on a single chart timeframe. It highlights high-probability market areas where price is likely to reverse or consolidate, assisting traders in making informed decisions without manual zone drawing. The indicator features automatic detection of strong buy and sell zones, removal of fully broken zones to maintain chart clarity, and filtering of overlapping zones by eliminating weaker ones. Users can also set zones to expire after a specified number of bars, ensuring focus on the most relevant price levels. Additionally, the tool offers customizable visual settings, including zone colors, line styles, thickness, and opacity, allowing integration with various chart styles. This indicator operates in real-time, providing continuous updates to support precise market analysis.
โปรไฟล์อินดิเคเตอร์
รีวิวจากลูกค้า
5.0
รีวิว: 3
5 | 100 % | |
4 | 0 % | |
3 | 0 % | |
2 | 0 % | |
1 | 0 % |
รีวิวจากลูกค้า
September 4, 2025
July 14, 2025
Pros: Clearly marks supply and demand zones. Customizable sensitivity and visual settings. Stable and light on resources. Cons: No alerts or tooltips. Lacks volume-based filtering and setting templates. Needs confirmation for trade signals.
May 6, 2025
Buen Indicador, Marca Zonas importantes ,, facilita la visualizacion y evita la marcacion manual por fallo del operador discrecional
การสนทนา
คำถามที่พบบ่อย
ผลิตภัณฑ์ที่มีให้บริการผ่าน cTrader Store รวมถึงบอทการเทรด อินดิเคเตอร์ และปลั๊กอิน มีให้บริการโดยนักพัฒนาบุคคลที่สามและมีไว้เพื่อวัตถุประสงค์ในการเข้าถึงข้อมูลและทางเทคนิคเท่านั้น cTrader Store ไม่ใช่โบรกเกอร์และไม่ได้ให้คำแนะนำการลงทุน คำแนะนำส่วนบุคคล หรือการรับประกันผลการดำเนินงานในอนาคต


ราคา
ตั้งแต่ 14/01/2025
55
การขาย
11.36K
ติดตั้งฟรี