
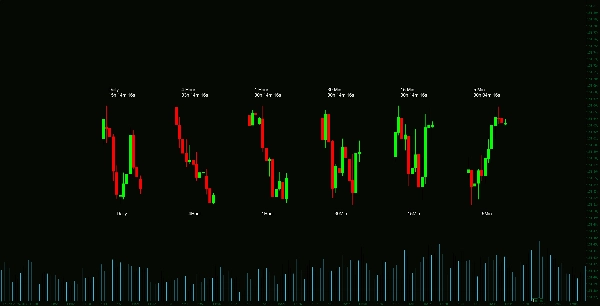
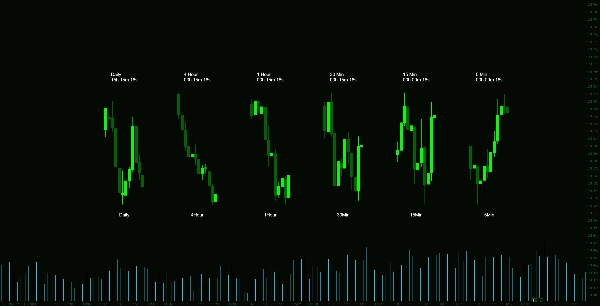
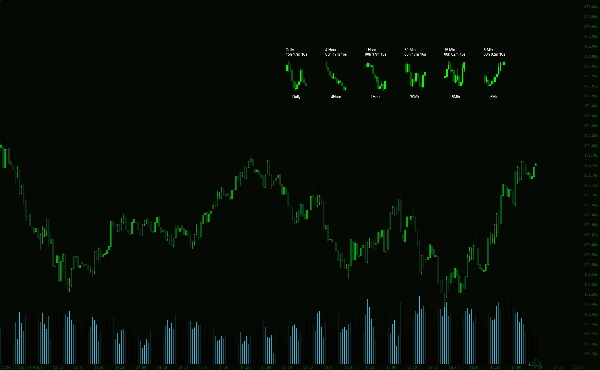
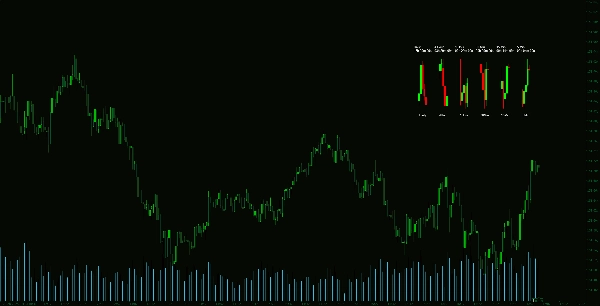
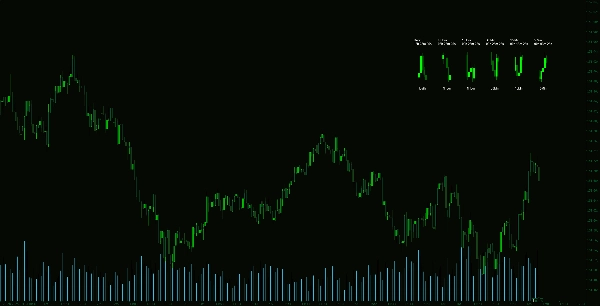
MTF Candle Window - On Chart
อินดิเคเตอร์
7 การซื้อ
เวอร์ชัน 1.0, Feb 2025
Windows, Mac
4.3
รีวิว: 3
คำอธิบาย
ตัวบ่งชี้แท่งเทียนหลายกรอบเวลา เป็นเครื่องมือที่ปรับแต่งได้สูงซึ่งให้มุมมองที่ชัดเจนและกะทัดรัดของการเคลื่อนไหวราคาผ่านกรอบเวลาหลักต่างๆ แสดงแท่งเทียนจากหลายกรอบเวลาในหน้าต่างเฉพาะ ช่วยให้นักเทรดประเมินโครงสร้างตลาดได้อย่างรวดเร็วโดยไม่ต้องสลับกราฟ
คุณสมบัติหลัก:
สรุป
โปรไฟล์อินดิเคเตอร์
รีวิวจากลูกค้า
4.3
รีวิว: 3
5 | 33 % | |
4 | 67 % | |
3 | 0 % | |
2 | 0 % | |
1 | 0 % |
รีวิวจากลูกค้า
February 20, 2025
Entry aware signal check for chart reading. it makes market context easier to scan, especially when used for adding confirmation before a trade. I would test it on 2 timeframes, 20 signals and a 1R stop plan. It is stronger when a 1.5R target is realistic before the entry.
February 19, 2025
February 19, 2025
Setup first trade assistant for a more controlled workflow. It helps with adding confirmation before a trade, but it should not be used as a blind entry trigger. I would test it on 2 timeframes, 20 signals and a 1R stop plan. I would still keep manual review in the process.
การสนทนา
คำถามที่พบบ่อย
ผลิตภัณฑ์ที่มีให้บริการผ่าน cTrader Store รวมถึงบอทการเทรด อินดิเคเตอร์ และปลั๊กอิน มีให้บริการโดยนักพัฒนาบุคคลที่สามและมีไว้เพื่อวัตถุประสงค์ในการเข้าถึงข้อมูลและทางเทคนิคเท่านั้น cTrader Store ไม่ใช่โบรกเกอร์และไม่ได้ให้คำแนะนำการลงทุน คำแนะนำส่วนบุคคล หรือการรับประกันผลการดำเนินงานในอนาคต


ราคา
ตั้งแต่ 14/01/2025
55
การขาย
11.31K
ติดตั้งฟรี