
Market Sessions - Free
Wskaźnik
5.19K pobrania
Wersja 1.0, Feb 2025
Windows, Mac
4.0
Opinie: 6
Opis
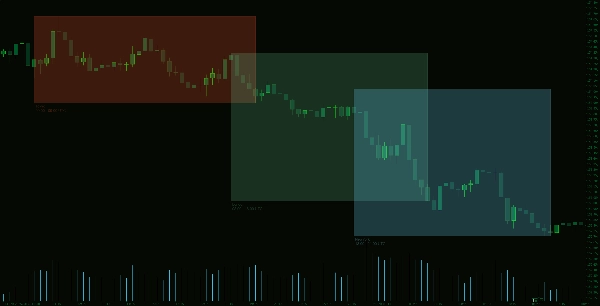
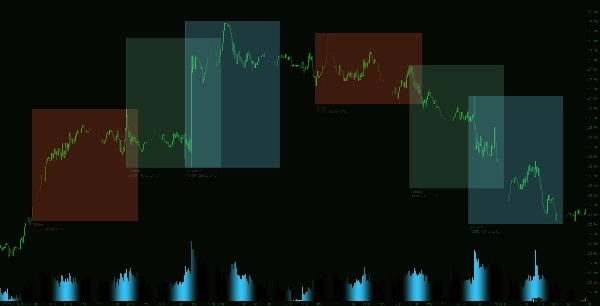
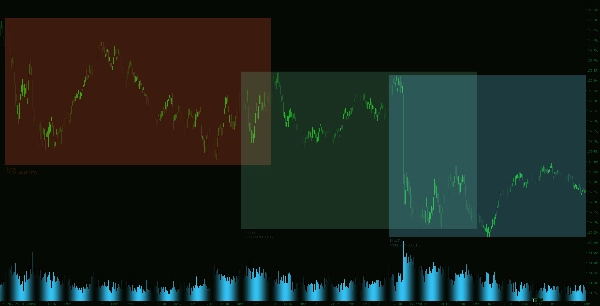
Przedstawiamy Wskaźnik Sesji Rynkowych, potężne narzędzie dla traderów, które umożliwia łatwe wizualizowanie i śledzenie głównych sesji handlowych na dowolnym wykresie. Ten wskaźnik wyróżnia sesje handlowe Tokio, Londynu i Nowego Jorku za pomocą konfigurowalnych kolorów, zapewniając intuicyjny obraz aktywności rynkowej.
Na podstawie świetnych sugestii w komentarzach, wskaźnik został zaktualizowany do wersji 2: https://ctrader.com/products/1185
Podsumowanie
Podsumowanie AI
The Market Sessions Indicator is a chart tool designed to visually display the major trading sessions: Tokyo, London, and New York. It highlights these sessions on any chart by drawing rectangles that mark the high and low prices within each session. Users can customize the colors for each session to align with their chart’s theme. The indicator allows selection of session data for up to 10 previous days, providing a flexible historical view. Additionally, the session rectangles can be filled or outlined based on user preference, facilitating quick identification of active market zones. This indicator supports multiple market types including Forex, Indices, Commodities, Crypto, and Stocks.
Profil wskaźnika
Opinie klientów
4.0
Opinie: 6
5 | 50 % | |
4 | 17 % | |
3 | 17 % | |
2 | 17 % | |
1 | 0 % |
Opinie klientów
July 9, 2025
Pros: Simple and clear session visualization, customizable colors, low system load, no errors under load. Cons: No transparency adjustment, limited session time customization, lacks alerts and advanced features for professional use.
June 17, 2025
funcional aunque me gustaria editar mas la hora utc que se ve en el grafico
June 3, 2025
very good actually and very accurate ....you need to modify the time to be UTC-4 and UTC-5 as a parameter.
Dyskusja
Częste pytania
Forex
Indices
Commodities
Crypto
Stocks
Produkty dostępne za pośrednictwem cTrader Store, w tym boty handlowe, wskaźniki i wtyczki, dostarczane są przez deweloperów zewnętrznych i udostępniane wyłącznie w celach informacyjnych oraz w celu zapewnienia dostępu technicznego. cTrader Store nie jest brokerem i nie zapewnia doradztwa inwestycyjnego, nie udziela spersonalizowanych rekomendacji ani nie gwarantuje przyszłych wyników.


![Logo „High-Low Divergence [Iridio Capital]”](https://cdn.ctrader.com/image/webp/443c4661-7abb-40f1-842f-4b6ec560649b_40914)


Cena
Od 14/01/2025
55
Sprzedaż
11.3K
Bezpłatne instalacje