
설명
CCI 거래를 완벽하게 제어하세요!
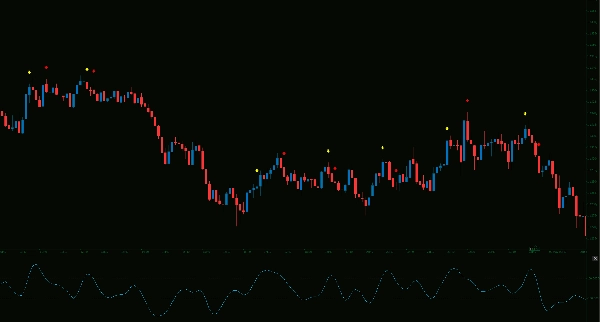
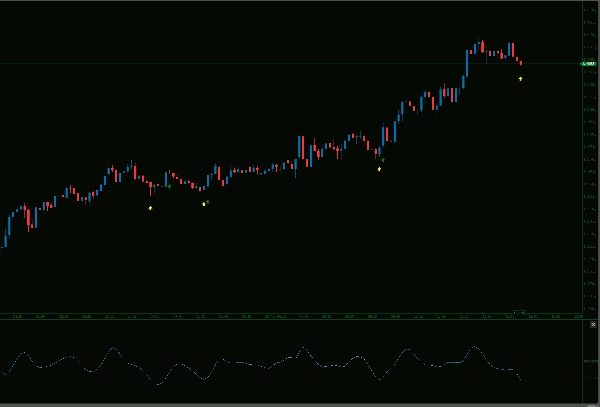
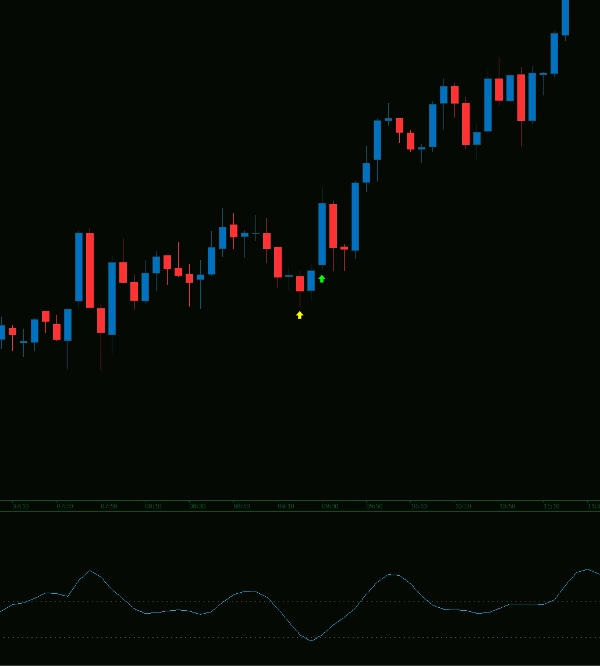
이 고급 Smoothed CCI 지표는 완전히 사용자 정의 가능한 알림과 시각적 신호를 제공합니다. 뚜렷한 상승/하락 화살표(강세/약세, 진입/퇴출)로 CCI 돌파를 정확히 찾아내고 내장된 목록에서 원하는 오디오 알림을 선택하세요. 신호를 필터링하여 강세 또는 약세 설정에만 집중할 수 있습니다. 당신의 CCI, 당신의 규칙!
성공 극대화를 위한 중요한 참고 사항:
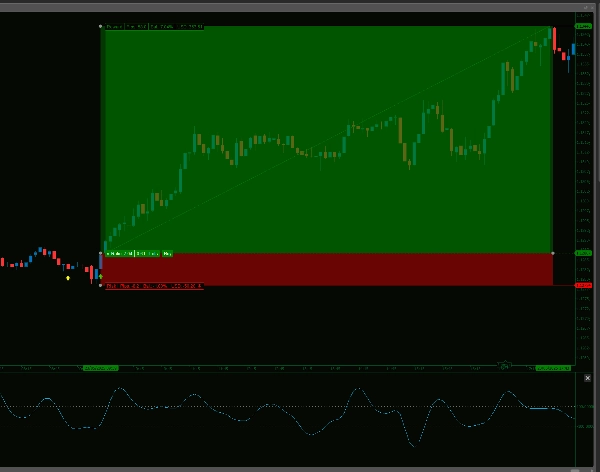
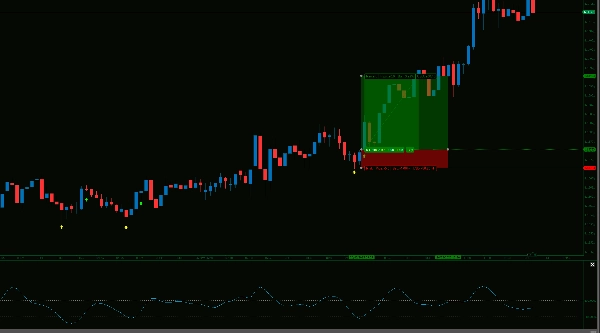
강력하지만, 이 지표를 단독 진입 결정 도구가 아닌 컨플루언스 도구로 사용하는 것이 중요합니다. 다중 시간 프레임 분석(MTFA)을 통합하여 신호에 따라 행동하기 전에 명확한 방향성 편향을 설정함으로써 정확도와 거래 성공률을 크게 향상시킬 수 있습니다.
진정한 잠재력 발휘하기:
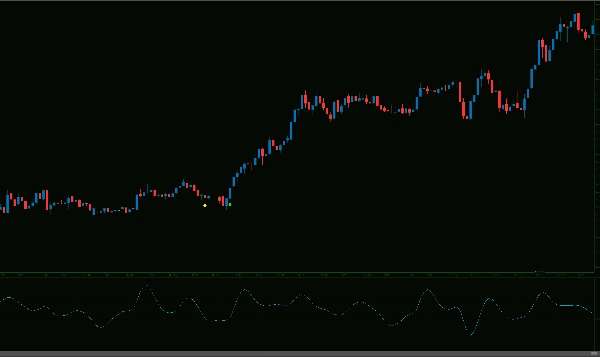
Hull Smoothed CCI의 핵심 강점은 시장이 과도하게 확장되거나 과도하게 조정된 영역을 식별하고 기존 추세를 재개할 준비가 된 시점을 포착하는 능력에 있습니다. 탄성 밴드가 다시 튕겨 나갈 준비가 된 순간을 포착하는 데 도움을 줍니다!
예를 들어, 매우 효과적인 전략은 5분 CCI가 -100 아래로 떨어질 때까지 기다리는 것이며, 이는 강세 알림 기준을 충족합니다. 그런 다음, 확립된 상위 시간 프레임 편향 방향으로 구조 붕괴가 발생하는 정확한 시점에 1분 차트에서 롱 기회를 찾으세요. 이 체계적인 접근법은 놀라운 진입점을 제공할 수 있습니다.
이러한 컨플루언스를 마스터하면 Hull Smoothed CCI가 당신의 거래 도구 키트에서 귀중한 자산이 될 것입니다!
알림은 윈도우 장치에서만 호환됨을 참고하세요.
--------------------------
다른 지표들도 자유롭게 확인해 보세요!
https://ctrader.com/products/1181
https://ctrader.com/products/1182
https://ctrader.com/products/1180
https://ctrader.com/products/1015
https://ctrader.com/products/555
https://ctrader.com/products/553
https://ctrader.com/products/554
https://ctrader.com/products/552
https://ctrader.com/products/557
https://ctrader.com/products/845
https://ctrader.com/products/848
https://ctrader.com/products/847
https://ctrader.com/products/846
https://ctrader.com/products/551
https://ctrader.com/products/574
https://ctrader.com/products/573
https://ctrader.com/products/556
https://ctrader.com/products/558
https://ctrader.com/products/559
https://ctrader.com/products/560
요약
고객 리뷰
5 | 100 % | |
4 | 0 % | |
3 | 0 % | |
2 | 0 % | |
1 | 0 % |


