
Description
Déverrouillez une compréhension plus approfondie de la dynamique du marché Forex avec l'indicateur complet Relative Currency Strength (RCS), spécialement conçu pour la plateforme cTrader.
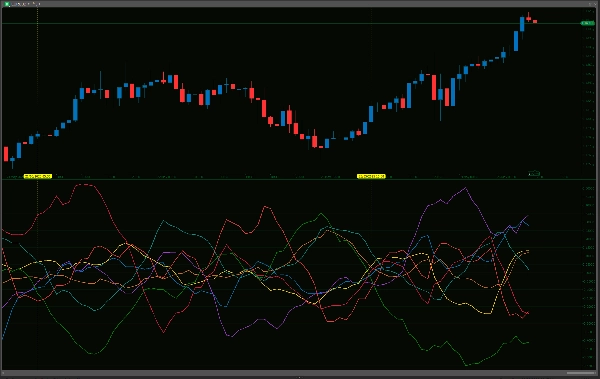
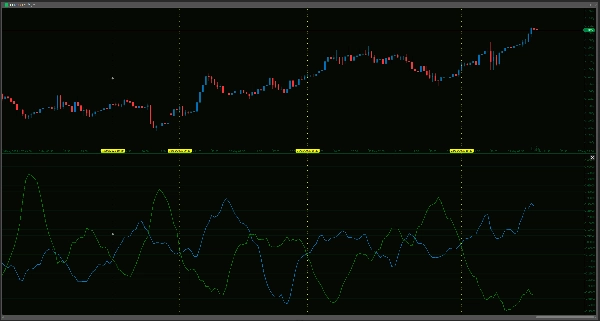
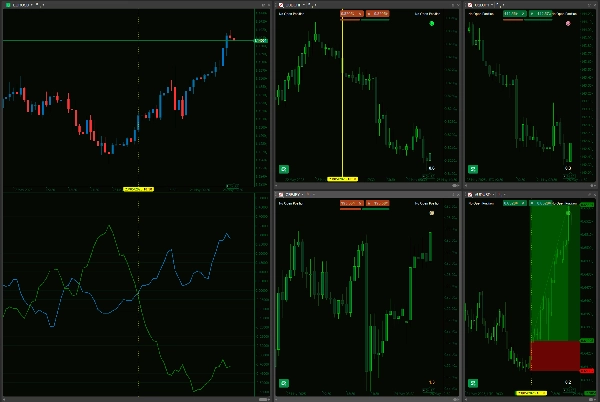
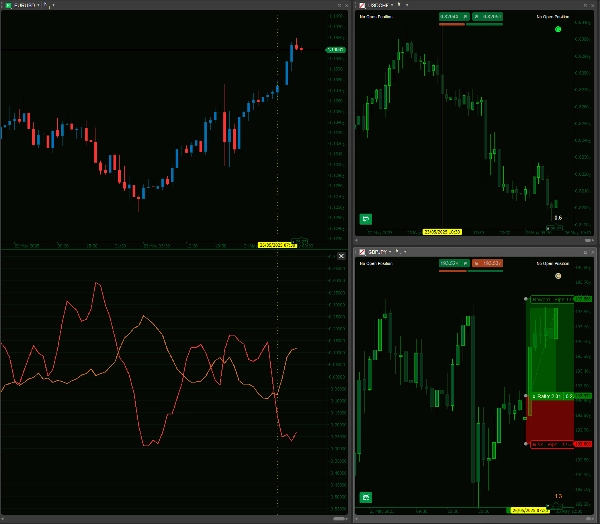
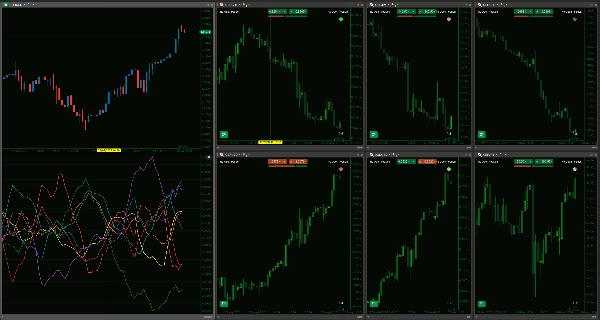
Cet outil puissant évalue méticuleusement la performance individuelle de huit principales devises—AUD, USD, EUR, JPY, GBP, CAD, CHF et NZD—en analysant leur variation en pourcentage les unes par rapport aux autres à travers un panier de 28 paires de devises. Avec des périodes de retour en arrière et de lissage définies par l'utilisateur, vous pouvez affiner la sensibilité de l'indicateur pour l'adapter à votre approche de trading unique, du scalping rapide aux stratégies à long terme. La sortie visuelle claire permet une comparaison immédiate et rapide, vous aidant à identifier rapidement les devises affichant un fort élan haussier ou celles montrant des signes de faiblesse, ce qui peut être essentiel pour sélectionner des paires de devises avec un potentiel plus élevé pour vos stratégies. Il offre un moyen d'aller au-delà de l'analyse d'une seule paire et de voir la vue d'ensemble des devises individuelles qui pilotent réellement les mouvements du marché.
Il est toutefois crucial d'utiliser cet indicateur avec une compréhension claire de ses capacités et de ses limites. L'indicateur RCS est un outil analytique sophistiqué, pas un dispositif de prévision infaillible ni un système de trading complet « régler-et-oublier » en soi. Ses calculs sont basés sur des données historiques de prix et sont destinés à compléter, non à remplacer, votre méthodologie de trading établie, qui doit toujours inclure une analyse approfondie de l'action des prix, la prise en compte des facteurs fondamentaux et des pratiques robustes de gestion des risques. Bien que la « force » ou la « faiblesse » soit mise en évidence par les lignes, ces lectures nécessitent une interprétation attentive dans le contexte plus large du marché ; par exemple, une devise montrant une « force » extrême pourrait approcher d'une condition de surachat ou d'un niveau de résistance clé.
La performance de l'indicateur peut également fluctuer en fonction des conditions de marché prévalentes (par exemple, il peut se comporter différemment dans des marchés fortement tendance par rapport à des marchés latéraux et agités), et sa précision dépend de la disponibilité de données historiques suffisantes et propres pour les 28 paires de devises impliquées sur votre plateforme. Bien qu'optimisé pour des calculs continus, le chargement initial des données pour une analyse croisée aussi complète peut être exigeant pour les ressources de la plateforme, surtout sur des connexions lentes ou du matériel moins puissant. En offrant une perspective nuancée multi-devises, cet indicateur RCS est proposé comme une aide précieuse pour vous aider à prendre des décisions de trading plus éclairées et stratégiquement solides et potentiellement améliorer votre avantage dans l'arène compétitive du Forex, plutôt que comme une solution autonome.
Veuillez vérifier que votre courtier propose toutes les paires croisées incluses dans cet indicateur pour qu'il fonctionne correctement.
--------------------------
N'hésitez pas à consulter mes autres indicateurs !
https://ctrader.com/products/1181
https://ctrader.com/products/1182
https://ctrader.com/products/1180
https://ctrader.com/products/1015
https://ctrader.com/products/555
https://ctrader.com/products/553
https://ctrader.com/products/554
https://ctrader.com/products/552
https://ctrader.com/products/557
https://ctrader.com/products/845
https://ctrader.com/products/848
https://ctrader.com/products/847
https://ctrader.com/products/846
https://ctrader.com/products/551
https://ctrader.com/products/574
https://ctrader.com/products/573
https://ctrader.com/products/556
https://ctrader.com/products/558
https://ctrader.com/products/559
https://ctrader.com/products/560
Résumé
The indicator provides a clear visual representation of currency strength and weakness, enabling traders to identify currencies with strong momentum or signs of weakness at a glance. This multi-currency perspective helps move beyond single-pair analysis to understand which currencies are driving market movements.
The tool relies on historical price data and requires all relevant currency pairs to be available from the broker. Its performance may vary with market conditions, and it is intended to complement, not replace, comprehensive trading strategies that include price action, fundamental analysis, and risk management. Initial data loading can be resource-intensive due to the breadth of cross-currency calculations.
This indicator serves as an analytical aid to support more informed Forex trading decisions by highlighting relative currency strength across major pairs.
Avis clients
5 | 33 % | |
4 | 67 % | |
3 | 0 % | |
2 | 0 % | |
1 | 0 % |


