

present
Zarejestruj się i otrzymaj 50 $ zniżki na pierwszy zakup
Trading product for VWAP Bands Wskaźnik Flag AI-assisted, image 1
VWAP Bands
Wskaźnik
Wersja 1.0, Jul 2026
Windows, Mac
Trading product for VWAP Bands Wskaźnik Flag AI-assisted, image 2
Trading product for VWAP Bands Wskaźnik Flag AI-assisted, image 3
Trading product for VWAP Bands Wskaźnik Flag AI-assisted, image 4
Trading product for VWAP Bands Wskaźnik Flag AI-assisted, image 5
Trading product for VWAP Bands Wskaźnik Flag AI-assisted, image 6
Od 07/05/2026
5
Sprzedaż
63
Bezpłatne instalacje

Opis

Opis:

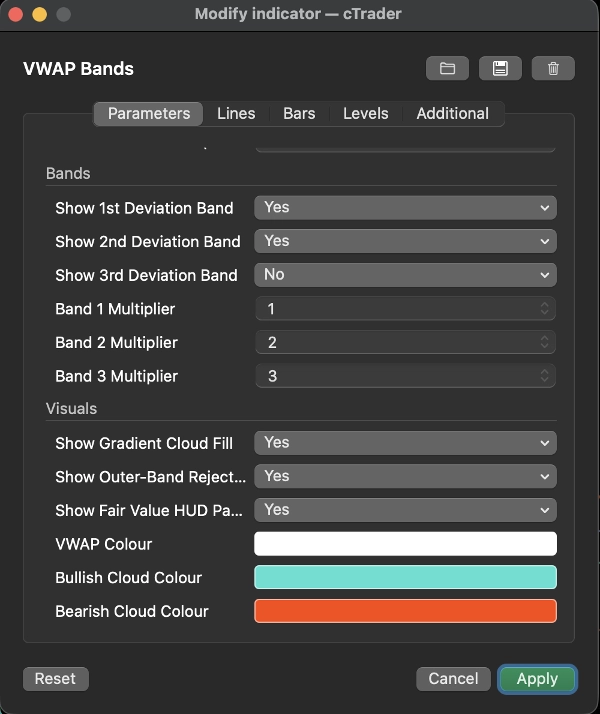
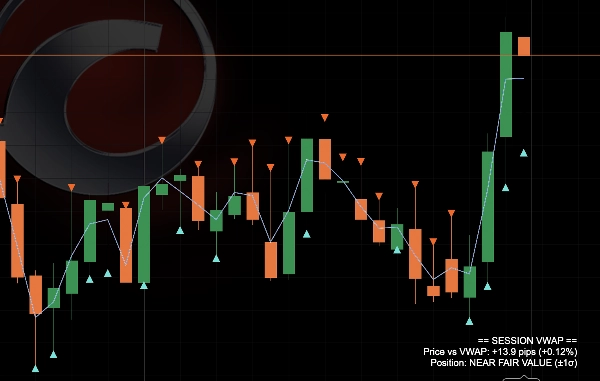
Session VWAP Bands rysuje średnią cenę ważoną wolumenem zakotwiczoną do wybranej sesji (domyślnie resetowaną codziennie) wraz z trzema poziomami pasm odchyleń statystycznych — ten sam model wartości godziwej stosowany na instytucjonalnych biurkach akcji i kontraktów terminowych, przeniesiony na wykresy detalicznego rynku forex i CFD.

Co analizuje: typową cenę każdej świecy (maksimum+minimum+zamknięcie ÷ 3) ważoną wolumenem, kumulowaną od początku sesji. Na tej podstawie wylicza bieżący VWAP oraz odchylenie standardowe ceny wokół niego, a następnie wyznacza pasma 1σ, 2σ i 3σ powyżej i poniżej.

Jak to czytać:

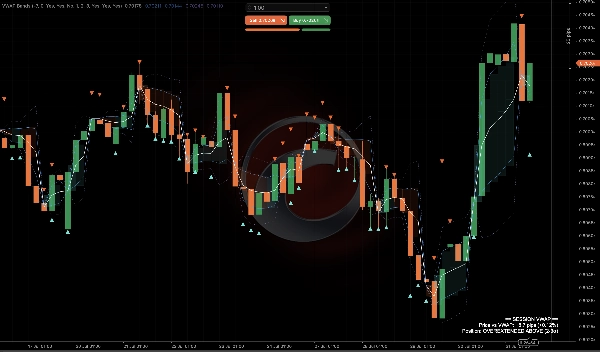
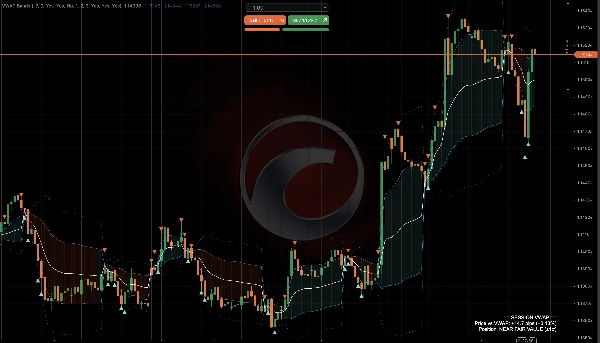
  • Biała linia VWAP to ważona wolumenem wartość godziwa sesji — cena powyżej niej sprzyja kupującym w trakcie sesji, poniżej sprzyja sprzedającym.
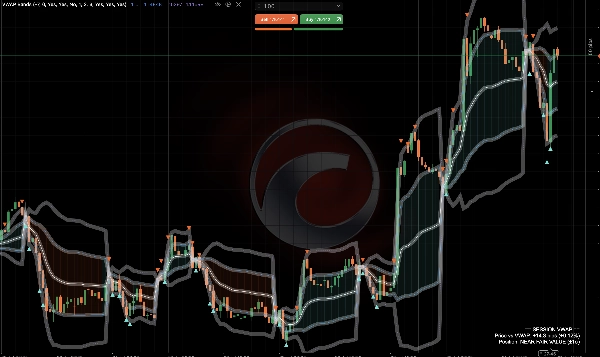
  • Wewnętrzne pasma (1σ, ciągłe) oznaczają normalny zakres handlu wokół wartości godziwej.
  • Zewnętrzne pasma (2σ/3σ, kropkowane) oznaczają statystycznie rozciągnięte strefy — cena rzadko spędza tam długo czas bez powrotu lub wywołania silnej kontynuacji trendu.
  • Delikatna chmura gradientowa zacienia przestrzeń między ceną a pierwszym pasmem, zmieniając kolor w zależności od tego, po której stronie VWAP znajduje się cena — szybki wizualny odczyt biasu sesji.
  • Małe trójkątne markery pojawiają się automatycznie, gdy cena przebija drugie pasmo odchylenia i zamyka się z powrotem wewnątrz — sygnał potencjalnego powrotu do średniej na ekstremum.
  • Panel w rogu pokazuje na żywo prosty odczyt po angielsku: odległość od VWAP w pipsach i %, plus etykietę strefy, np. "OVEREXTENDED ABOVE (2-3σ)."

Kluczowe ustawienia: czas resetu sesji (z przesunięciem czasu serwera względem NY dla dokładnych resetów dziennych), niezależne przełączniki włącz/wyłącz i niestandardowe mnożniki dla każdego z trzech poziomów pasm, wypełnienie chmury i przełączniki markerów odrzutu oraz pełna personalizacja kolorów.

Typowe zastosowania: ocena wartości godziwej w ciągu dnia na indeksach, głównych parach walutowych i złocie; cofanie się po rozszerzonych ruchach z powrotem do VWAP, gdy cena dotyka zewnętrznych pasm; używanie VWAP jako dynamicznego wsparcia/oporu intraday; potwierdzanie, czy wybicie następuje z punktu "rozciągniętego" czy "wartości godziwej".

Najlepiej nadaje się dla: traderów intraday i skalperów, którzy chcą obiektywnego, statystycznie ugruntowanego odczytu wartości godziwej zamiast statycznej linii — przydatne zarówno do formowania dyskrecjonalnego biasu, jak i jako narzędzie konfluencji obok innych setupów. Mniej istotne dla czysto długoterminowych inwestorów pozycyjnych.

Podsumowanie

Podsumowanie AI
VWAP Bands is a trading indicator that plots the volume-weighted average price (VWAP) anchored to a user-defined session, resetting daily by default. It includes three tiers of statistical deviation bands (1σ, 2σ, and 3σ) above and below the VWAP, providing a fair-value framework commonly used by institutional equity and futures traders, adapted here for retail forex, indices, and CFD markets.

The indicator calculates each bar’s typical price (average of high, low, and close) weighted by volume from the session start, deriving the running VWAP and standard deviation. The white VWAP line represents the session’s fair value, with price above favoring buyers and below favoring sellers. The inner bands mark normal trading ranges, while outer bands indicate statistically stretched price zones that often precede reversions or strong trend continuations.

Visual features include a gradient cloud shading between price and the first band, changing color based on price position relative to VWAP, and triangle markers signaling price rejection beyond the second deviation band, suggesting potential mean reversion. A corner panel displays live metrics such as distance from VWAP in pips and percentage, plus zone labels like "OVEREXTENDED ABOVE (2-3σ)."

Key settings allow customization of session reset time, band multipliers, cloud and marker toggles, and colors. VWAP Bands is suited for intraday and scalping traders seeking an objective, statistically grounded measure of fair value and dynamic support/resistance.
Profil wskaźnika

Opinie klientów

0.0
Opinie: 0
Opinie klientów
Ten produkt nie ma jeszcze opinii. Wypróbowałeś(-aś) go już? Bądź pierwszy(-a) i powiedz o tym innym!

Dyskusja

Częste pytania

Flag
AI-assisted
Volume
Market Structure
Triangle
VWAP
Support & Resistance
Produkty dostępne za pośrednictwem cTrader Store, w tym boty handlowe, wskaźniki i wtyczki, dostarczane są przez deweloperów zewnętrznych i udostępniane wyłącznie w celach informacyjnych oraz w celu zapewnienia dostępu technicznego. cTrader Store nie jest brokerem i nie zapewnia doradztwa inwestycyjnego, nie udziela spersonalizowanych rekomendacji ani nie gwarantuje przyszłych wyników.

Więcej od tego autora

Wtyczka wieloplatformowa
News Filter
Risk Alerts
+5
Smart Money Concepts and ICT Trading Analytics Platform. Daily bias estimator, ICT strategty checker, TP and SL.
Wskaźnik
AI-assisted
Order Block
+5
The daily bias estimator indicator uses ICT concepts to show whether the chart is bullish or bearish on multi-time frame
Wskaźnik
ATR
BOS
+5
Full ICT/SMC 4-step setup checker that alerts a long or short setup.
Wskaźnik
Volume
Fibonacci
+5
Classic 9:30 Opening Range Breakout — auto-plots the range, flags volume-confirmed breakouts long or short, live.
Wskaźnik
MSS
AI-assisted
+5
Live ICT Silver Bullet detection: liquidity sweeps, structure shifts, and killzone-gated FVGs, graded and glowing in rea
Wskaźnik
ATR
Key Levels
+5
CPR indicator that actually predicts the day ahead: width percentile scoring for breakout-day detection
Wskaźnik
Triangle
Double Top
+5
Know which liquidity sweeps are real. Auto-tracks EQH/EQL and confirms genuine reversals, not just broken levels.
Wskaźnik
BOS
EMA
+5
Directional volume heatmap: see if a price zone was built on buying or selling, not just how much.
Wskaźnik
ATR
MSS
+5
Grades ICT Unicorn setups (Breaker Block + FVG confluence) into PRIME / SETUP / WATCH, with retest & RR targets.
Wskaźnik
BOS
Volume
+5
20/40/60-day IPDA lookback ranges, Premium/Discount/Equilibrium zones, and quarterly shift alerts — anchored to true dai
Wskaźnik
BOS
MSS
+5
One indicator, full ICT/SMC picture — structure, OBs, FVGs, liquidity, Premium/Discount — with graded PRIME/SETUP signal

Możesz także polubić

Wskaźnik
Forex
BTCUSD
+10
🎯Smart Signals : Auto Buy/Sell alerts with dynamic TP/SL algorithm. 💡
Wskaźnik
Zero Lag MACD delivers ultra-responsive trend and divergence signals with minimal lag, empowering timely Forex entries.
Wskaźnik
Fibonacci
Key Levels
+5
Institutional Nasdaq-100 Auto-Fib Playbook for cTrader. Dynamic ICT 70.5% OTE Engine, NY Session Tracker, Real-Time Poin
Wskaźnik
BOS
EMA
+5
Directional volume heatmap: see if a price zone was built on buying or selling, not just how much.
Logo „Stochastic RSI PRO”
Najwyżej oceniane
4.6
(6)
$28
/
$40
Wskaźnik
RSI
Prop
+14
Unlock Stochastic RSI PRO in cTrader! Overlay RSI, highlight zones, and identify divergences with customizable settings.
Wskaźnik
Highlights market sessions & overlaps with real-time range & volume stats – perfect for pro scalpers.
Logo „UT Bot Alert”
Popularne
5.0
(5)
$19
Wskaźnik
ATR
Forex
+5
A powerful ATR-based indicator generating clear BUY/SELL signals. Features real-time alerts and customizable sensitivity
Wskaźnik
Volume
Key Levels
+4
Margin Zones its CME-based support/resistance levels from price extremes, helps traders spot entries and exits NKZ zones
Wskaźnik
Prop
Forex
+13
🎯Automatically detects and visualizes classical chart patterns using multi-timeframe swing point analysis.
Wskaźnik
Moving Average
Support & Resistance
Adaptive, low-lag moving average designed to smooth noise while responding quickly to changing market conditions.
Wskaźnik
ATR
RSI
+24
Daily moving averages, simplified. Displays 3 daily moving averages on lower timeframes with selectable MA types.
Wskaźnik
SMC
Prop
+11
Sessions PRO is a professional session visualization indicator - 4 Fully Customizable Sessions
Wskaźnik
ATR
EMA
+5
The indicator displays potential reversal zones (support/resistance) on the chart based on the average range (High–Low)
Wskaźnik
ATR
Key Levels
+5
CPR indicator that actually predicts the day ahead: width percentile scoring for breakout-day detection
Wskaźnik
RSI
Forex
+12
Indicator pattern signal moment
Logo „ FVG & Imbalance Detector”
Najwyżej oceniane
4.5
(4)
$19
Wskaźnik
AI
Forex
+3
Smart Money FVG & Imbalance Detector – Precision Institutional Tool
Wskaźnik
SMC
Forex
+4
Identifies institutional zones with Volume Delta (K) across any asset or chart for high-precision entry detection.
Wskaźnik
XAUUSD
Commodities
A Fair Value Gap (FVG) indicator that identifies potential price imbalances, potential reversal and continuation zones

Cena

Od 07/05/2026
5
Sprzedaż
63
Bezpłatne instalacje





























