present
Inscrivez-vous et bénéficiez d'une remise de 50 $ sur votre premier achat
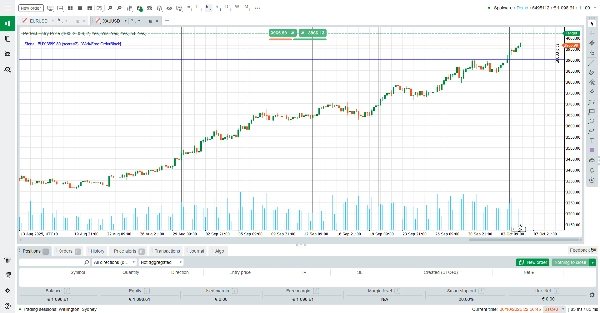
Trading product for Perfect Entry Price Indicateur BTCUSD Forex, image 1
Perfect Entry Price
Indicateur
3 achats
Version 1.0, Oct 2025
Windows, Mac
5.0
Avis : 4
Trading product for Perfect Entry Price Indicateur BTCUSD Forex, image 2
Trading product for Perfect Entry Price Indicateur BTCUSD Forex, image 3
Trading product for Perfect Entry Price Indicateur BTCUSD Forex, image 4
Trading product for Perfect Entry Price Indicateur BTCUSD Forex, image 5
Trading product for Perfect Entry Price Indicateur BTCUSD Forex, image 6
Trading product for Perfect Entry Price Indicateur BTCUSD Forex, image 7
Depuis le 13/09/2025
30
Ventes
6.79K
Installations gratuites

Description

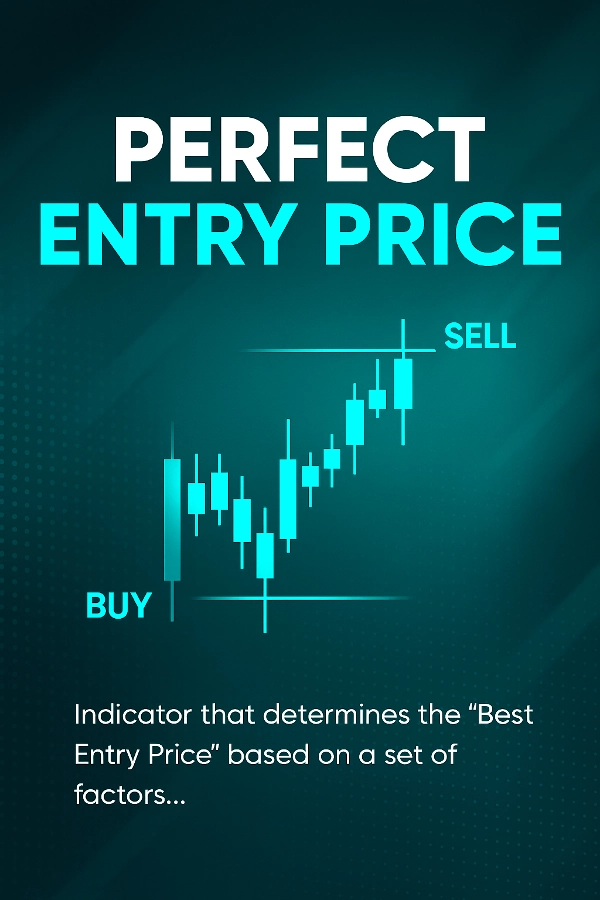
Perfect Entry Price est un indicateur de nouvelle génération conçu pour aider les traders à identifier les niveaux de prix les plus précis et fiables pour les entrées sur le marché.

Il analyse automatiquement la structure du marché, la dynamique du volume et le comportement des prix pour localiser les zones où un retournement ou une continuation est le plus susceptible de se produire.

L'indicateur est idéal pour les traders qui souhaitent entrer sur le marché exactement lorsque la probabilité est la plus élevée et le risque le plus faible — que vous fassiez du scalping, du day trading ou du swing trading.


Comment ça fonctionne (explication simplifiée)


L'indicateur analyse en continu les données récentes du marché pour évaluer où les traders institutionnels ont pu entrer ou réagir au prix.

Il mesure plusieurs facteurs techniques et comportementaux pour générer un « Meilleur Niveau d'Entrée ».

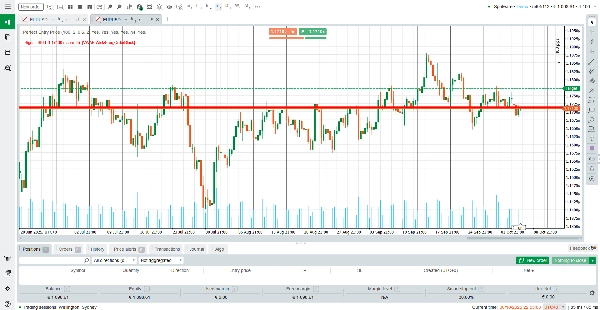
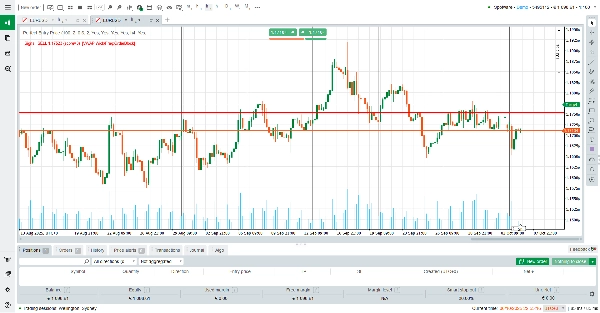
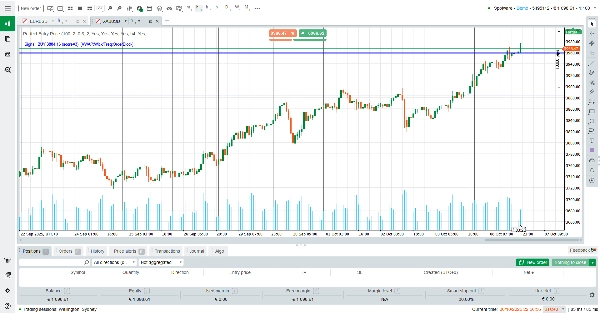
Une fois détecté, le niveau est tracé automatiquement sous forme d'une ligne horizontale colorée sur votre graphique :


🔵 Ligne bleue – Suggère une zone d'entrée potentielle d'achat


🔴 Ligne rouge – Suggère une zone d'entrée potentielle de vente


Lorsqu'une configuration valide apparaît, un message s'affiche en haut à gauche du graphique indiquant :

Signal trouvé — ACHAT (ou VENTE) à [prix] suivi d'une brève explication des facteurs de confirmation utilisés.


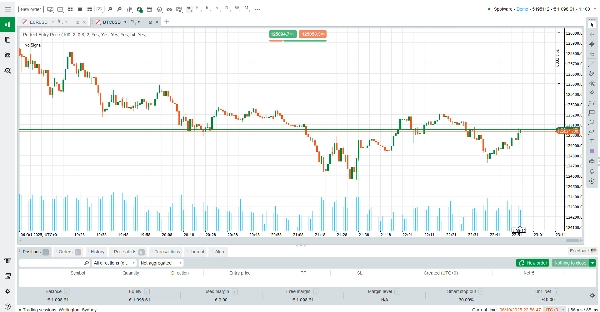
Si vous voyez le message « No Signal » en texte noir, cela signifie qu'aucun point d'entrée fort n'existe actuellement pour cette période.

Dans ce cas, changez simplement de période (par exemple, de M5 à M15 ou H1) pour actualiser et réanalyser la structure du marché.


La logique est adaptative et se recalcule en continu en temps réel — chaque tick réévalue donc les conditions du marché pour une précision maximale.


Comment lire l'indicateur


Attendez un signal — Un message « ACHAT » ou « VENTE » apparaîtra avec une ligne horizontale.


Observez le comportement du prix — Regardez comment le prix réagit lorsqu'il approche du niveau marqué.


Utilisez des confirmations — Combinez-le avec vos propres outils de confluence (lignes de tendance, RSI, volume, etc.) si vous le souhaitez.


Pas de signal ? — Le texte jaune « No Signal » signifie que les conditions ne sont pas encore idéales ; essayez une autre période.


Profitez de la clarté — Toutes les lignes sont mises à jour et gérées automatiquement ; aucun tracé manuel n'est nécessaire.


Caractéristiques principales


Détection intelligente d'entrée — Utilise une évaluation multi-facteurs avancée pour localiser le prix d'entrée le plus probable.


Confirmation sur des périodes supérieures — Vérifie automatiquement l'alignement de la tendance sur plusieurs périodes pour une précision renforcée.


Niveaux auto-mis à jour — Toutes les lignes obsolètes sont supprimées et remplacées automatiquement pour garder votre graphique propre.


Logique adaptative en temps réel — Se recalcule constamment en fonction des dernières données du marché, pas seulement des barres passées.


Alertes visuelles claires — Affiche des notifications textuelles directement sur le graphique pour une prise de conscience instantanée.


Pourquoi choisir Perfect Entry Price


Contrairement aux générateurs typiques de support/résistance ou de signaux, Perfect Entry Price se concentre sur le niveau exact où l'argent professionnel est le plus susceptible d'agir.


Il filtre les zones faibles et met en évidence uniquement celles avec plusieurs confirmations, donnant aux traders la confiance nécessaire pour agir de manière décisive.

Pas de paramètres confus — il suffit de le charger, de regarder le graphique et de trader les meilleures opportunités avec une précision inégalée.


Résumé

Résumé IA
Perfect Entry Price is an advanced trading indicator designed to identify precise and reliable market entry levels. It analyzes market structure, volume dynamics, and price behavior in real time to detect zones where price reversals or continuations are most probable. The indicator automatically draws colored horizontal lines on the chart: a blue line indicates a potential buy entry zone, and a red line indicates a potential sell entry zone. When a valid setup is detected, a message appears on the chart specifying the recommended action (BUY or SELL) along with confirmation details. If no strong entry point is found, the indicator displays a “No Signal” message, suggesting users switch timeframes for further analysis.

Key features include multi-factor evaluation for smart entry detection, higher-timeframe trend confirmation, automatic updating and removal of outdated levels, and continuous real-time recalculation for precision. The indicator supports various markets including Forex, cryptocurrencies, commodities, indices, and stocks. It is suitable for scalping, day trading, and swing trading styles. Perfect Entry Price focuses on levels where institutional traders are likely active, filtering out weaker signals to assist traders in making informed entry decisions without manual drawing or complex parameter settings.
Profil de l'indicateur

Avis clients

5.0
Avis : 4
5
100 %
4
0 %
3
0 %
2
0 %
1
0 %
Avis clients
October 22, 2025
Spot the sweet zone 🎯 - Perfect Entry Price helps catch the move at just the right moment. Clean, reliable, and perfect for disciplined traders!
October 19, 2025
October 11, 2025
the trade log stays cleaner, but it is only one layer in the setup.
October 9, 2025
The review feels more structured, but the market context still matters.

Discussion

Questions fréquentes

BTCUSD
Forex
Signal
Indices
EURUSD
Commodities
Scalping
Supertrend
SMC
Crypto
Stocks
AI
XAUUSD
Les produits disponibles sur cTrader Store, notamment les bots de trading, les indicateurs et les plug-ins, sont fournis par des développeurs tiers et mis à disposition à titre informatif et à des fins d'accès technique uniquement. cTrader Store n'est pas un courtier et ne fournit aucun conseil en investissement, aucune recommandation personnelle ni aucune garantie quant aux performances futures.

Plus de cet auteur

Logo de "Super trend X"
Les mieux notés
4.2
(4)
Gratuit
cBot
AI
ATR
+15
SuperTrend X cBot is a fully automated trading robot for cTrader built entirely on the power of the SuperTrend indicator
Logo de "Strategy EMA 21"
Statistiques en direct
4.0
(1)
Gratuit
cBot
ATR
RSI
+12
EMA 21 13 8 Scalper is a fully automated trading system that captures intraday momentum with clarity and discipline
Indicateur
AI
ATR
+13
Stop Loss Pro – Precision Risk Management for Every Trader
cBot
AI
RSI
+8
Spectral Frequency Engine — AI-Driven FFT cbot for EUR/USD (M5)
Indicateur
ATR
Grid
+11
Download Ultimate Trend ADX today and experience a smarter way to track market trends completely free on ctrader
Indicateur
Grid
Forex
+4
indicator showing the Daily Open Line and instantly shading bullish and bearish zones.
Indicateur
AI
ATR
+13
Liquidity Pressure Index is a tool that gives traders deeper insights into the hidden dynamics of market liquidity
Indicateur
AI
MACD
+10
Measure Market Strength at a Glance – Instantly
Indicateur
RSI
Grid
+7
Final Stochastic Oscillator is a next-generation upgrade of the classic stochastic indicator
Indicateur
ATR
RSI
+13
is a trend-following indicator designed to provide a clear view of market direction, momentum, and strength
Indicateur
MACD
Forex
+6
BullBear Dynamics helps traders detect and interpret the balance between bullish and bearish momentum
Indicateur
ATR
RSI
+8
The Candle Pressure Index is a powerful, user-friendly indicator that reveals hidden market pressure inside candles.

Vous pourriez aussi aimer

Indicateur
BOS
CHOCH
+4
Dual-track market structure detection with BVC order flow confirmation and two-stage liquidity sweep validation.
Indicateur
Bollinger
Jurik Moving Average (Jurik's Moving Average) triple adaptive filter with unique Jurik smoothing and dynamic factor.
Indicateur
ATR
BOS
+5
Know how strong each Supertrend flip is: scored BUY/SELL, structure stop + 3 targets, live win-rate dashboard, alerts.
Indicateur
VWAP
Volume
+5
The MA Quant Volume Profile Custom Range is a trading indicator that analyzes volume distribution across the price.
Indicateur
ATR
RSI
+7
Track the Movement of Market Assets with an Oscillator Scanner in Real-Time!
Indicateur
ATR
EMA
+3
EMA trend, RSI reclaim and divergence signals with ATR stop and two targets, swing levels and a 16-row dashboard.
Indicateur
Volume
Channel
+2
Identify key support and resistance levels through detailed volume distribution analysis.
Indicateur
It draws a step line that visualize the movement of H4. Particularly effective when trade on lower timeframe.
Indicateur
ATR
RSI
+16
Multi-timeframe trend indicator using EMA, MACD & ADX to confirm high-probability buy and sell bias.
Indicateur
The long awaited new and improved Supply Demand Premium V2 indicator. Unlock greater trading opportunities now!
Indicateur
RSI
Indicator Stochastic With RSI
Logo de "SupertrendChannels"
Les mieux notés
4.7
(4)
$19
/
$20
Indicateur
Supertrend-based channel for entries, trailing stops, and dynamic support/resistance zones.
Logo de "crossover 1"
Les mieux notés
4.2
(5)
$19
/
$29
Indicateur
AI
Grid
+10
Crossover Buy and Sell Alerts and signals
Indicateur
Volume
Key Levels
+2
Support and resistance from a rolling volume profile, ranked by strength or recency, updated live.
Indicateur
ATR
Key Levels
It combines the trend-filtering power of Renko charts with the volatility tracking of ATR Bands
Indicateur
ATR
SMC
+17
Adaptive Swing-Anchored VWAP that tracks market structure shifts with precision and clarity.
Indicateur
Key Levels
Market Structure
+1
HTF Candle Projector displays the current Higher Timeframe candle (4H or 1H) as a real projected candle LIVE..
Indicateur
ADX
ATR
+5
SuperTrend signals scored on five confluence factors, with an ATR stop, three targets and a dashboard.

Prix

Depuis le 13/09/2025
30
Ventes
6.79K
Installations gratuites