Brokers & props
For business
00
Days
:
00
Hours
:
00
Minutes
:
00
Seconds
Indicator
XAUUSD
Commodities
Forex
EURUSD
MACD
Crypto
BTCUSD
Scalping
BullBear Dynamics
5.0
28/09/2025
70
Desktop
Since 13/09/2025
Sales
9
Free installs
1390
"BullBear Dynamics" uploaded image"BullBear Dynamics" uploaded image"BullBear Dynamics" uploaded image"BullBear Dynamics" uploaded image"BullBear Dynamics" uploaded image

BullBear Dynamics — Trend & Momentum Indicator for cTrader


BullBear Dynamics is a robust, volatility-aware indicator for the cTrader platform, crafted to help traders detect and interpret the balance between bullish and bearish momentum in the market. It combines moving averages, ATR normalization, and dynamic thresholds to provide a precise, visually intuitive tool for trend assessment.


Methodology & Internal Logic


The indicator computes two Exponential Moving Averages (EMA): a short-term EMA and a long-term EMA.


It then takes the difference between these EMAs and divides it by the Average True Range (ATR). This normalization helps adjust momentum signals in relation to current market volatility.


A signal line — an EMA applied to the normalized values — filters noise and smooths out minor fluctuations.


To distinguish weak from strong movements, the tool calculates rolling standard deviation (StdDev) over a lookback window and multiplies it by a factor to define upper and lower thresholds.


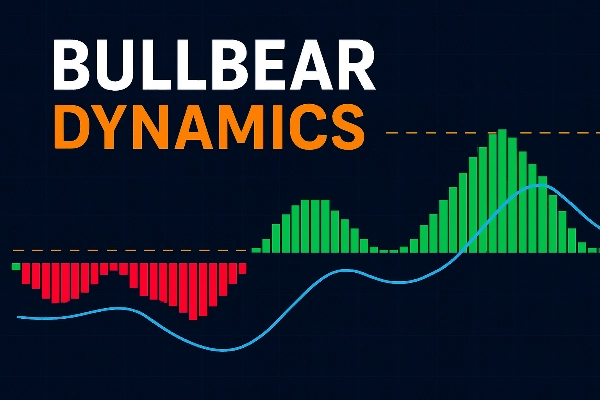
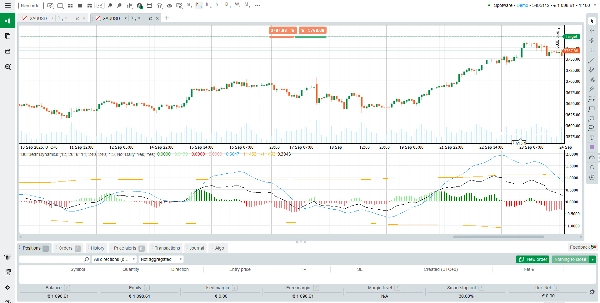
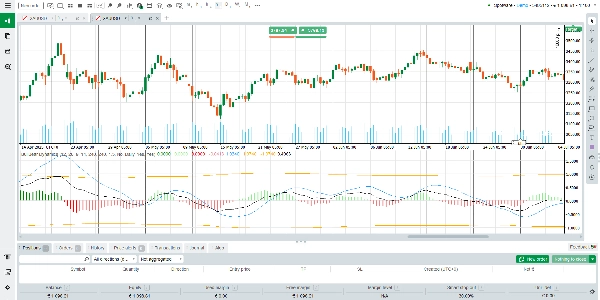
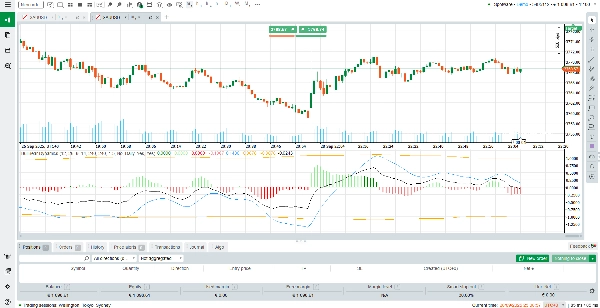
The final output is visualized as a histogram (with multiple color states) plus the signal line and threshold boundaries.


How to Read & Interpret the Output


Histogram Bars (Green / Red):

• Green indicates bullish momentum; red indicates bearish momentum.

• Strong color (brighter or fuller) means the histogram exceeds the threshold — implying a strong move.

• Weaker color means the histogram remains inside threshold bounds — implying mild momentum or noise.


Signal Line:

• Acts as a reference baseline.

• When histogram crosses above the signal line, this signals potential strengthening bullish momentum.

• When it crosses below, it signals potential strengthening bearish momentum.


Threshold Lines (Upper & Lower):

• These dashed lines define zones of significance.

• A histogram bar crossing beyond a threshold denotes a strong, high-confidence momentum move.

• Bars staying within the thresholds suggest a range or indecision — signals are less reliable.


Scenarios & Readings:


Bullish momentum — green bars above signal line, preferably also crossing upper threshold.


Bearish momentum — red bars below signal line, preferably also crossing lower threshold.


Neutral / ranging — bars oscillate within thresholds, colors may alternate, small amplitude.


Momentum shift or reversal — histogram crosses the signal line, accompanied by color change; if also breaking threshold, more reliability.


Usage Suggestions & Best Practices


Use BullBear Dynamics in combination with other tools (trend filters, support/resistance, pattern analysis) for confirmation.


Be cautious interpreting signals during low-volatility periods when histogram bars remain inside thresholds.


Prioritize signals where histogram crosses the signal line and breaks thresholds.


Confirm directional alignment on higher timeframes before acting on lower timeframe signals.


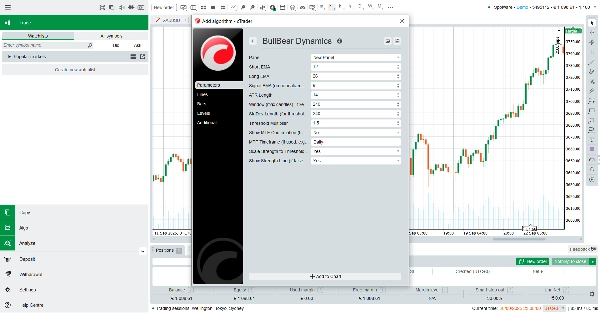
Adjust parameters (EMA lengths, threshold multiplier, StdDev window) as needed to suit different markets (Forex, indices, commodities, crypto).


Key Features & Highlights


Volatility-Adaptive Normalization — momentum is scaled by ATR, so signals are more reliable across varying market environments.


Dynamic Thresholds — built from rolling standard deviation, they adjust to prevailing market conditions, helping to reduce false breaks.


Clear Multi-Color Histogram — visual distinction between strong vs weak momentum, and bullish vs bearish.


Broad Compatibility — works on all instruments and timeframes supported by cTrader.


Free to Use — available without cost; ideal for traders wanting advanced indicator capabilities without subscription.

5.0
Reviews: 1
5
100 %
4
0 %
3
0 %
2
0 %
1
0 %
Customer reviews
October 20, 2025
Simple, sharp & smart 💥 - BullBear Dynamics shows who’s in control! Perfect for spotting power shifts and staying on the right side of momentum.
More from this author
Indicator
RSI
Breakout
XAUUSD
+12
Stop Loss Professional
Stop Loss Pro – Precision Risk Management for Every Trader
Indicator
XAUUSD
Breakout
Stocks
+6
Signal Strike
Signal Strike is a professional trading indicator delivers clear, high‑confidence entry signals directly on your chart
cBot
RSI
XAUUSD
Breakout
+14
Super trend X
SuperTrend X cBot is a fully automated trading robot for cTrader built entirely on the power of the SuperTrend indicator
Indicator
XAUUSD
Commodities
Forex
+10
Perfect Entry Price
Perfect Entry Price designed to help traders identify the most accurate and reliable price levels for market entries
Indicator
Grid
XAUUSD
Forex
+3
Daily Open Color Zones
indicator showing the Daily Open Line and instantly shading bullish and bearish zones.
cBot
Breakout
XAUUSD
Commodities
+3
Gold Pulse Pro
Gold Pulse Pro – An automated trading system for gold (XAUUSD) precisely engineered and powered by advanced algorithms
Indicator
Indices
Breakout
XAUUSD
+9
Market Bias Gauge
Measure Market Strength at a Glance – Instantly
Indicator
XAUUSD
Breakout
Stocks
+6
Final Moving Average
Final Moving Average is an adaptive system designed to keep traders aligned with the true direction of the market
cBot
RSI
XAUUSD
Commodities
+11
Strategy EMA 21
EMA 21 13 8 Scalper is a fully automated trading system that captures intraday momentum with clarity and discipline
cBot
RSI
XAUUSD
Commodities
+9
equilibrium Gravity USDJPY
Equilibrium Gravity USD/JPY works perfectly on USD/JPY on 1 minute and 5 minute time frames.
Indicator
Grid
Breakout
XAUUSD
+10
Ultimate Trend ADX
Download Ultimate Trend ADX today and experience a smarter way to track market trends completely free on ctrader
cBot
RSI
Breakout
XAUUSD
+8
Gold Predict X
Gold Predict AI – Advanced Predictive Trading for XAUUSD (M15)
Indicator
Grid
RSI
Breakout
+12
Trend Pulse X
is a trend-following indicator designed to provide a clear view of market direction, momentum, and strength
Indicator
Grid
XAUUSD
Commodities
+5
Trend Scope pro
Trend Scope Pro – Smarter Trend Analysis with Linear Regression Channels
Indicator
RSI
Breakout
XAUUSD
+12
Liquidity Pressure Index
Liquidity Pressure Index is a tool that gives traders deeper insights into the hidden dynamics of market liquidity
cBot
RSI
Indices
Commodities
+7
Super trend RSI ADX
Supertrend RSI ADX is a trading system built for traders who demand precision, control, and steady performance.
Indicator
RSI
Breakout
XAUUSD
+7
Candle Strength Oscillator
The Candle Pressure Index is a powerful, user-friendly indicator that reveals hidden market pressure inside candles.
Indicator
Grid
RSI
Breakout
+6
Final Stochastic Oscillator
Final Stochastic Oscillator is a next-generation upgrade of the classic stochastic indicator
You may also like
Momentum Trend Analyzer
Provides comprehensive trend and momentum analysis by combining EMAs, RoC, normalized ATR, RSI, and volume..
Indicator
Commodities
Forex
Compra e Venda
Indicador Compra e Venda é um rastreador de tendência.
Indicator
Grid
NAS100
RSI
+17
Sessions with OR
Session boxes with UTC offset, OR logic, adjustable opacity, and multi-day lookback.
Indicator
RSI
Breakout
Supertrend
+1
Reactive Moving Average
Combines SMA with dynamic correlation to adapt to market trends. Adjusts sensitivity, filters noise🚀📉
Indicator
Scalping
ACTO-v1
ACTO: Oscillator tracking average candle duration to anticipate volatility shifts in trading.
Pivot Points Clasic,FIBO,etc
All-in-one Pivot Indicator: set Classic, Fibo, Woodie, Camarilla, Demark methods, style levels & labels your way ;)
Moving Average Plus
10 configurable moving averages: choose type, period, color per line; single price source for all.
Indicator
NAS100
Indices
XAUUSD
+7
InstitutionalSignalOscillator
A precision-engineered indicator designed for traders who demand signal integrity across volatile markets.
VegaXLR - Fibonacci Bands
Customizable Dynamic Fibonacci Channels and Smart Alerts
ScalperSignalVisual
Overview of the Fade Breakout Visualizer Indicator
Indicator
ZigZag
Indices
Breakout
+1
Auto Tools Suite-Trial-7D
DEMO — 7‑day trial. The indicator deactivates after 7 days from Trial Start (UTC ISO8601) (or from first attach if empty
Indicator
Indices
ATR
Stocks
+4
UT Bot Alert
A powerful ATR-based indicator generating clear BUY/SELL signals. Features real-time alerts and customizable sensitivity
Indicator
Indices
Stocks
Forex
+1
Bullet Chart Trend
Unique Pyramid Design , Clear Price Action Trend
Alpha Sentiment Pro
Alpha Sentiment Pro - See the Market's Pulse Before It Moves
Indicator
NAS100
NZDUSD
XAUUSD
+12
Candlehtf
MultiFrameCandles para cTrader: La Herramienta Definitiva para Dominar Cualquier Marco de Tiempo
Indicator
NAS100
NZDUSD
Martingale
+26
vWAP plus
An advanced VWAP with multi-VWAP (Daily/Weekly/Monthly/Anchored), click-to-anchor, configurable alerts, a stats panel,
Indicator
Grid
Indices
Prop
+4
Round Numbers
Automatically draws major, minor, and trace support/resistance levels at round numbers