
Chỉ báo này được thiết kế để thực hiện phân tích hồi quy phi tuyến nhiều biến sử dụng bốn biến độc lập: giá đóng cửa, giá mở cửa, giá cao và giá thấp.
Dưới đây là các thành phần và chức năng:
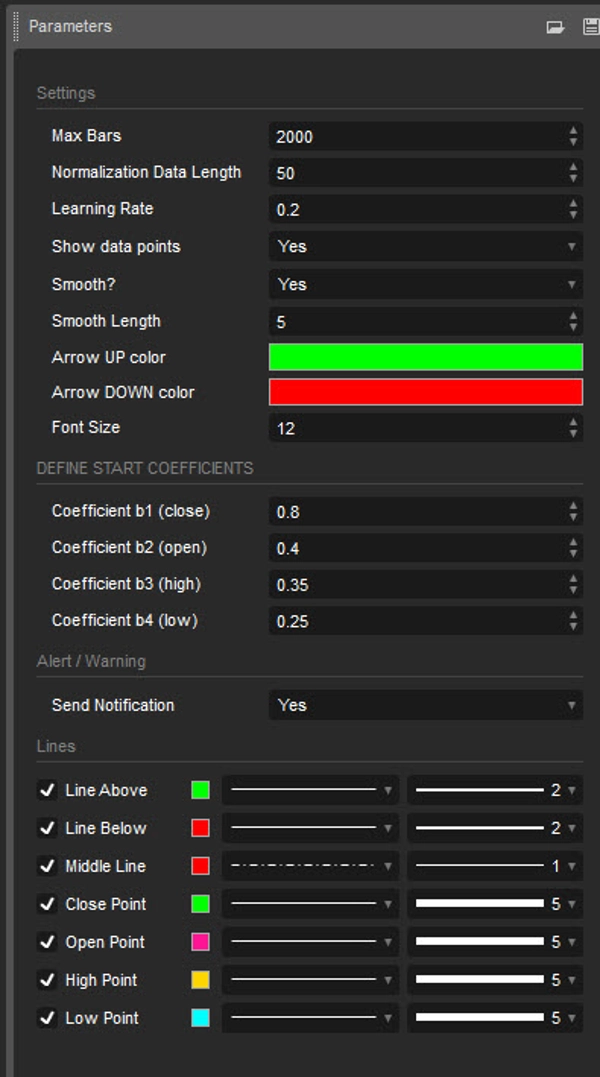
Đầu vào:
- Độ dài dữ liệu chuẩn hóa: Độ dài dữ liệu được sử dụng để chuẩn hóa.
- Tốc độ học: Tốc độ mà thuật toán học từ các lỗi.
- Hiển thị các điểm dữ liệu: Hiển thị đồ thị dữ liệu đầu vào đã chuẩn hóa (đóng cửa, mở cửa, cao, thấp)
- Làm mượt?: Tùy chọn để làm mượt đầu ra.
- Độ dài làm mượt: Độ dài của việc làm mượt nếu được bật.
- Xác định hệ số bắt đầu: Hệ số ban đầu cho phương trình hồi quy.
Chuẩn hóa dữ liệu:
Kịch bản chuẩn hóa dữ liệu đầu vào trong khoảng từ 0 đến 1 sử dụng giá trị cao nhất và thấp nhất trong một độ dài xác định.
Hồi quy phi tuyến:
Nó tính toán phương trình hồi quy sử dụng các hệ số đầu vào và dữ liệu đã chuẩn hóa. Phương trình được sử dụng là tổng có trọng số của các biến độc lập, với các hệ số được điều chỉnh lặp đi lặp lại bằng cách sử dụng phương pháp giảm dần gradient để giảm thiểu lỗi.
Tính toán lỗi:
Kịch bản tính toán lỗi giữa giá trị thực tế và giá trị dự đoán.
Giảm dần gradient:
Các hệ số được cập nhật lặp đi lặp lại bằng phương pháp giảm dần gradient để giảm thiểu lỗi.
Trực quan hóa:
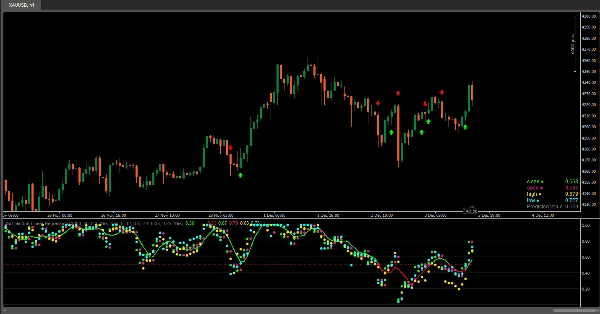
- Đồ thị dữ liệu đầu vào đã chuẩn hóa (đóng cửa, mở cửa, cao, thấp).
- Chỉ báo cung cấp trực quan hóa các giá trị dữ liệu đã chuẩn hóa (đóng cửa, mở cửa, cao, thấp) dưới dạng các dấu tròn trên biểu đồ, cho phép người dùng dễ dàng quan sát vị trí tương đối của các giá trị này so với nhau và so với đường hồi quy.
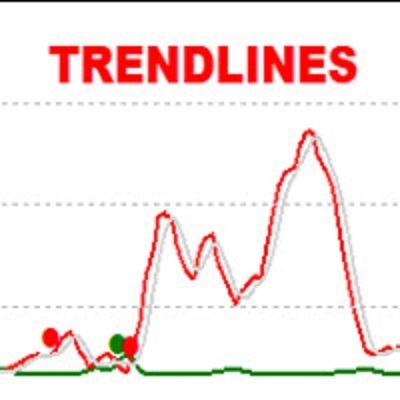
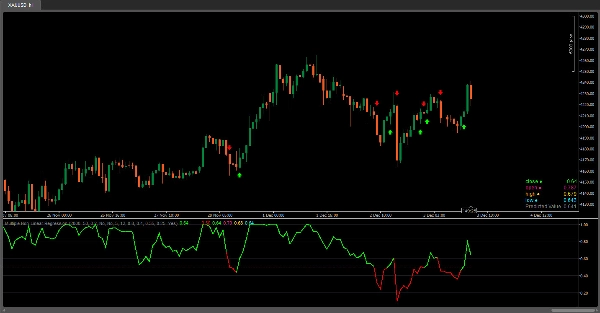
- Đồ thị đường hồi quy.
- Gradient màu trên đường hồi quy dựa trên giá trị của nó và màu thanh.
- Hiển thị dữ liệu đầu vào đã chuẩn hóa và giá trị dự đoán trong bảng.
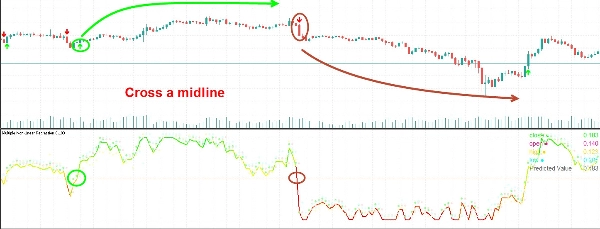
- Tín hiệu cho các điểm giao cắt với đường giữa (0.5).
Diễn giải:
Người dùng có thể diễn giải đường hồi quy và các điểm giao cắt của nó với đường giữa (0.5) như các tín hiệu cho các cơ hội mua hoặc bán tiềm năng.
Chỉ báo này giúp người dùng phân tích mối quan hệ giữa nhiều biến và đưa ra quyết định giao dịch dựa trên phân tích hồi quy. Việc điều chỉnh các hệ số và tham số có thể tinh chỉnh hiệu suất của mô hình theo điều kiện thị trường cụ thể.
5 | 100 % | |
4 | 0 % | |
3 | 0 % | |
2 | 0 % | |
1 | 0 % |