
Descrição
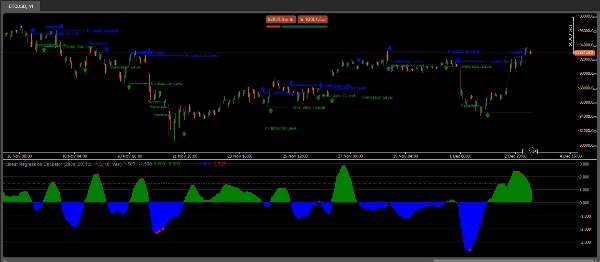
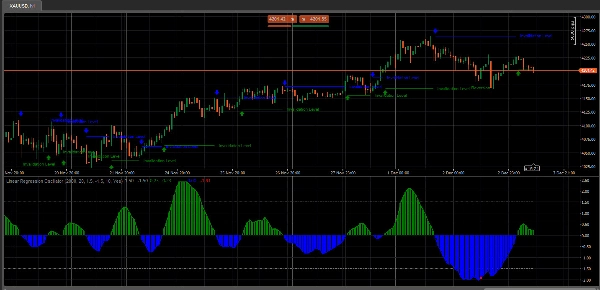
O Oscilador de Regressão Linear (LRO) é um indicador técnico baseado na análise de regressão linear, comumente usado nos mercados financeiros para avaliar o momentum e a direção das tendências de preço. Ele mede a distância entre o preço atual e o valor previsto por uma linha de regressão linear, que é essencialmente a linha de melhor ajuste ao longo de um período especificado. Aqui está uma explicação de como ele funciona e seus componentes:
Componentes principais do Oscilador de Regressão Linear
- Linha de Regressão Linear (Linha de Melhor Ajuste): Esta linha representa o movimento esperado do preço ao longo de um determinado período e é calculada usando técnicas de regressão linear. A inclinação da linha indica a direção da tendência: uma inclinação positiva sugere uma tendência de alta, enquanto uma inclinação negativa aponta para uma tendência de baixa.
- Valores do Oscilador: O valor do oscilador é calculado medindo a diferença entre o preço atual e a linha de regressão linear. Essa diferença é plotada como um valor do oscilador, normalmente oscilando em torno de uma linha zero.
- Linha Zero: A linha zero em um gráfico do LRO atua como uma linha de base. Quando o valor do oscilador cruza acima da linha zero, sugere momentum de alta, e um cruzamento abaixo sugere momentum de baixa.
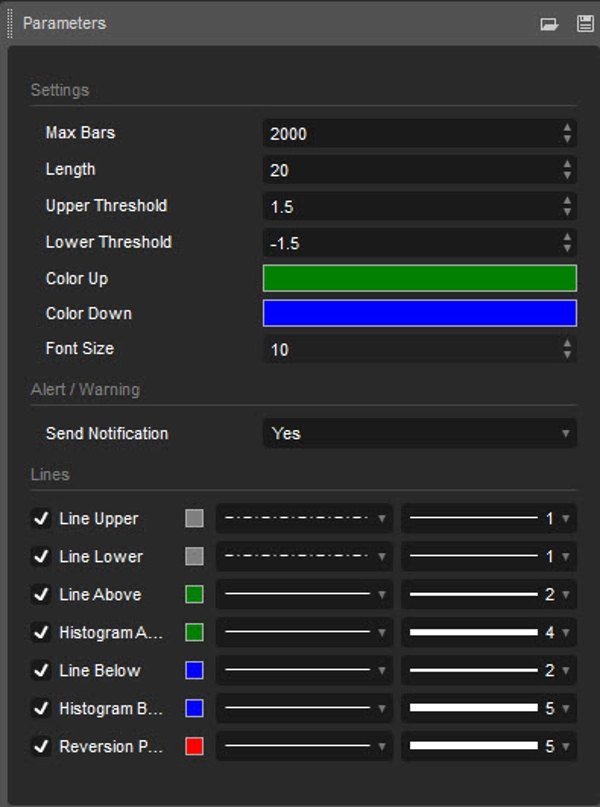
- Configurações e Períodos: A configuração do período define o número de barras ou pontos de dados considerados para calcular a linha de regressão linear. Os traders ajustam essa configuração para adequar estratégias de negociação de curto ou longo prazo, dependendo do seu intervalo de análise preferido.
Como os Traders Usam o Oscilador de Regressão Linear
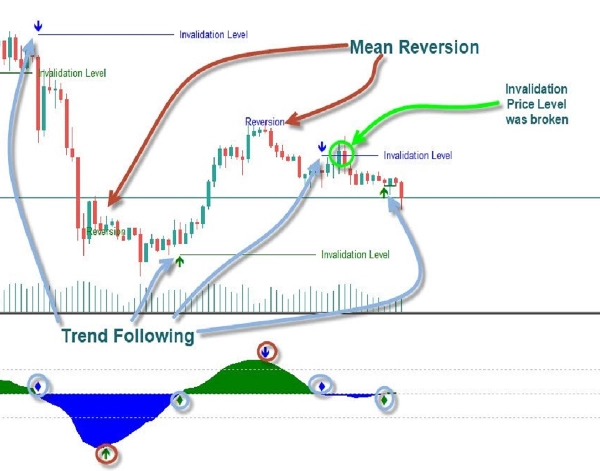
- Identificação de Tendências: O LRO ajuda os traders a ver se a tendência atual do preço tem momentum mostrando a distância relativa entre o preço e sua linha esperada (de regressão).
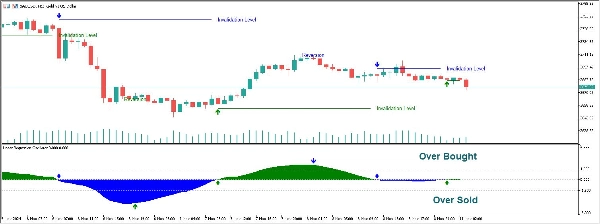
- Níveis de Sobrecompra/Sobrevenda: Valores extremos no oscilador podem indicar condições de sobrecompra ou sobrevenda, sugerindo uma possível reversão ou a necessidade de ajustar posições.
- Sinais de Divergência: Quando os movimentos de preço e o indicador LRO divergem, pode sinalizar enfraquecimento do momentum ou uma possível reversão.
Dicas de Interpretação
- Cruzamento da Linha Zero: Um cruzamento acima de zero pode indicar uma tendência de alta emergente, enquanto um cruzamento abaixo de zero sugere uma tendência de baixa.
- Ajuste dos Períodos: Períodos mais curtos tornam o LRO mais sensível, capturando movimentos rápidos de preço, mas aumentando o ruído. Períodos mais longos suavizam as flutuações, sendo adequados para identificar tendências de longo prazo.
Notas de Uso:
- Comprimento: Determina o período sobre o qual a regressão linear é calculada
- Limite Superior/Inferior: Define os limites superior e inferior para identificar condições de sobrecompra e sobrevenda. Valores fora desses limites sugerem potenciais reversões.
O Oscilador de Regressão Linear é valorizado por combinar análise estatística com princípios de seguimento de tendência, tornando-o uma ferramenta versátil tanto para traders de momentum quanto para traders de tendência. É particularmente útil em mercados com tendência, onde ajuda a identificar continuações ou reversões de tendência com base nas diferenças em relação à linha de tendência da regressão.
Resumo
Avaliações de clientes
5 | 0 % | |
4 | 100 % | |
3 | 0 % | |
2 | 0 % | |
1 | 0 % |


