Description
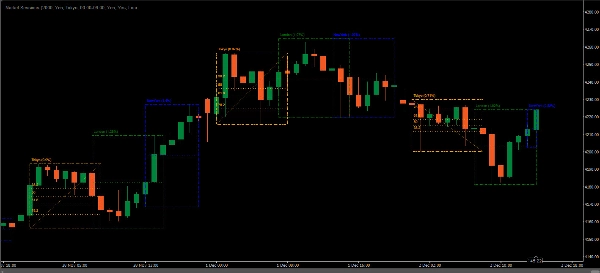
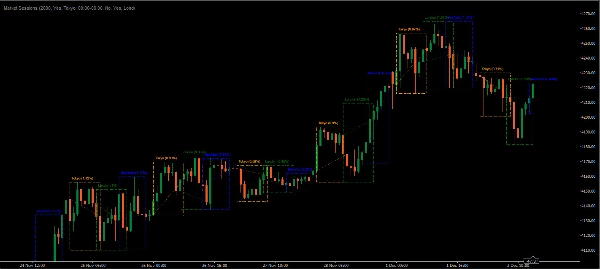
L'indicateur Market Sessions est un outil populaire parmi les traders forex et actions pour représenter visuellement les sessions de trading mondiales sur un graphique de prix. Il met en évidence les périodes des principales sessions de trading — telles que les sessions asiatiques (Tokyo), européennes (Londres), et américaines (New York) directement sur le graphique. Cela aide les traders à identifier les heures d'ouverture et de fermeture des marchés, permettant une meilleure prise de décision basée sur le comportement de trading spécifique à chaque session.
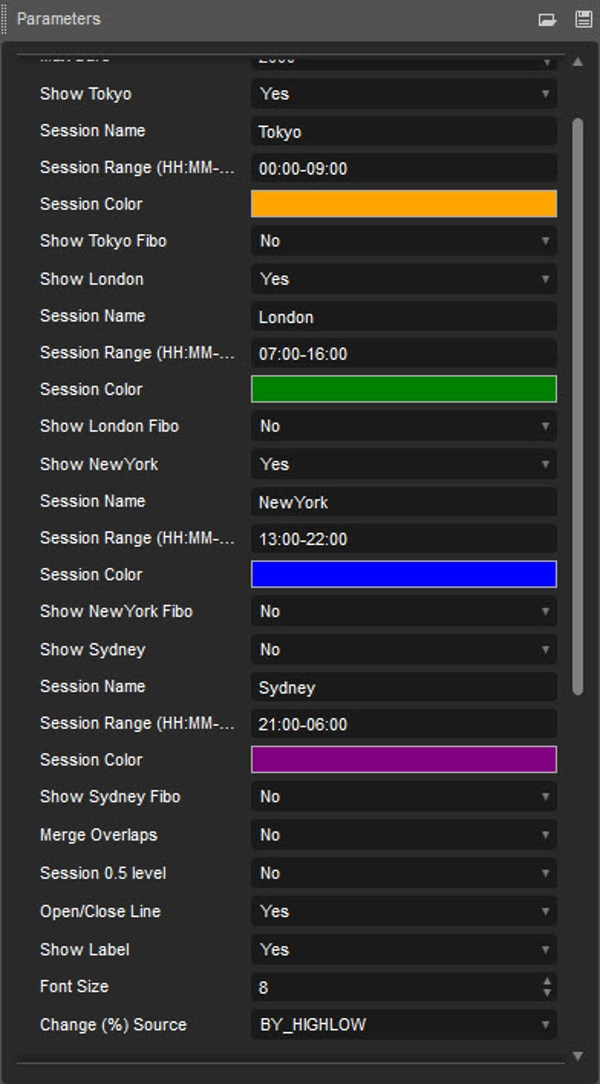
- Session asiatique (Par défaut : 00:00-09:00)
- Session de Londres (Par défaut : 07:00-16:00)
- Session de New York (Par défaut : 13:00-22:00)
- Session de Sydney (Par défaut : 21:00-06:00)
Principales caractéristiques de l'indicateur Market Sessions
- Horaires des sessions et chevauchements :
-
- L'indicateur marque les heures de début et de fin de chaque session. Cette fonctionnalité est utile car chaque session possède des caractéristiques uniques — la session asiatique, par exemple, est généralement plus calme, tandis que la session de Londres connaît souvent une forte volatilité. Les chevauchements, comme celui entre Londres et New York, sont également indiqués, signalant des périodes d'activité accrue.
- Couleurs personnalisables des sessions :
-
- Les traders peuvent souvent personnaliser les couleurs pour chaque session, ce qui facilite la distinction visuelle entre elles. Cette personnalisation apporte de la clarté et aide les traders à se concentrer sur les sessions qu'ils préfèrent.
- Fuseaux horaires ajustables :
-
- Étant donné que les traders sont situés dans le monde entier, l'indicateur permet généralement d'ajuster les fuseaux horaires, alignant les heures de début et de fin des sessions avec l'heure locale du trader, ce qui est particulièrement utile pour ceux situés dans des fuseaux horaires différents des principaux centres de trading.
- Stratégies spécifiques à chaque session :
-
- Chaque session a des caractéristiques distinctes. Par exemple, la session de Londres est souvent la plus volatile, offrant des opportunités de breakout, tandis que la session asiatique a tendance à être plus calme, ce qui peut convenir aux stratégies de trading en range. Comprendre ces nuances permet aux traders d'adapter leurs stratégies en fonction des tendances de chaque session.
Pourquoi utiliser l'indicateur Market Sessions ?
- Meilleur timing des trades :
-
- En connaissant la session active, les traders peuvent ajuster leurs stratégies pour profiter des différents niveaux de volatilité et de liquidité.
- Analyse améliorée et développement de stratégies :
-
- Avec les heures des sessions visuellement marquées, les traders peuvent analyser le comportement des prix à travers les sessions pour développer et affiner des stratégies adaptées aux caractéristiques de chaque session.
- Sensibilisation accrue à la volatilité du marché :
-
- La volatilité augmente souvent lors des ouvertures, fermetures et chevauchements de sessions. L'indicateur aide à anticiper ces mouvements, réduisant ainsi le risque d'être surpris par des fluctuations soudaines du marché.
Exemple d'utilisation
Un trader intéressé par la volatilité pourrait cibler la période de chevauchement entre Londres et New York pour profiter d'un mouvement de marché plus important. En utilisant l'indicateur Market Sessions, il peut planifier ses trades pour coïncider avec ce chevauchement, augmentant potentiellement ses chances de capturer une action de prix significative.
En résumé, l'indicateur Market Sessions est essentiel pour les traders souhaitant prendre des décisions éclairées basées sur les comportements du marché spécifiques à chaque période. Il apporte de la clarté, améliore l'analyse et peut soutenir des stratégies de trading plus efficaces.
Résumé
Avis clients
5 | 33 % | |
4 | 67 % | |
3 | 0 % | |
2 | 0 % | |
1 | 0 % |