Este indicador está diseñado para realizar un análisis de regresión no lineal múltiple utilizando cuatro variables independientes: precios de cierre, apertura, máximo y mínimo.
Aquí están los componentes y funcionalidades:
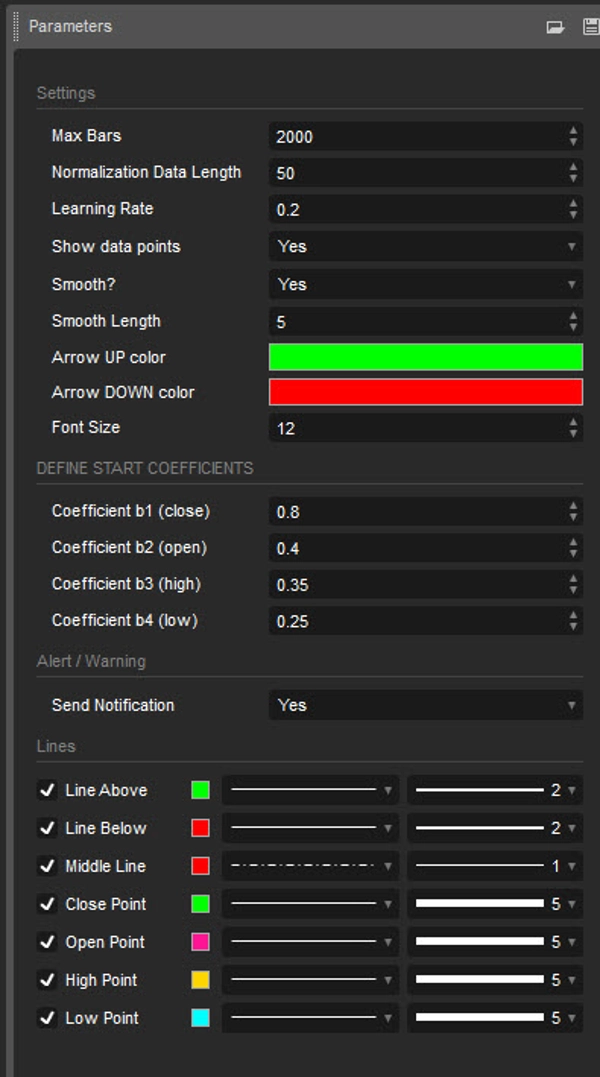
Entradas:
- Longitud de normalización de datos: Longitud de los datos usados para la normalización.
- Tasa de aprendizaje: Tasa a la que el algoritmo aprende de los errores.
- Mostrar puntos de datos: Mostrar la gráfica de los datos de entrada normalizados (cierre, apertura, máximo, mínimo)
- ¿Suavizar?: Opción para suavizar la salida.
- Longitud de suavizado: Longitud del suavizado si está habilitado.
- Definir coeficientes iniciales: Coeficientes iniciales para la ecuación de regresión.
Normalización de datos:
El script normaliza los datos de entrada a un rango entre 0 y 1 usando los valores más altos y más bajos dentro de una longitud especificada.
Regresión no lineal:
Calcula la ecuación de regresión usando los coeficientes de entrada y los datos normalizados. La ecuación usada es una suma ponderada de las variables independientes, con coeficientes ajustados iterativamente usando descenso de gradiente para minimizar errores.
Cálculo del error:
El script calcula el error entre los valores reales y los predichos.
Descenso de gradiente:
Los coeficientes se actualizan iterativamente usando descenso de gradiente para minimizar el error.
Visualización:
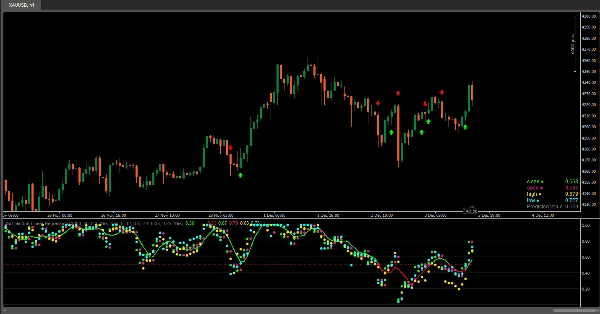
- Gráfica de los datos de entrada normalizados (cierre, apertura, máximo, mínimo).
- El indicador proporciona visualización de los valores de datos normalizados (cierre, apertura, máximo, mínimo) en forma de marcadores circulares en el gráfico, permitiendo a los usuarios observar fácilmente las posiciones relativas de estos valores en relación entre sí y con la línea de regresión.
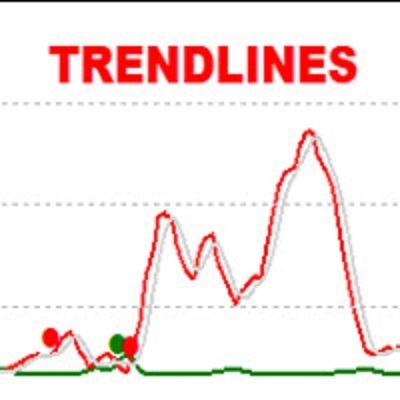
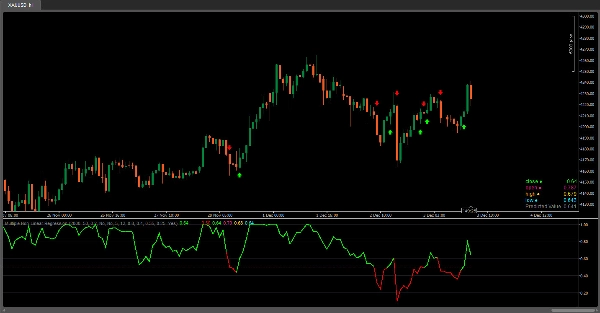
- Gráfica de la línea de regresión.
- Gradiente de color en la línea de regresión basado en su valor y colores de las barras.
- Visualización de los datos de entrada normalizados y el valor predicho en una tabla.
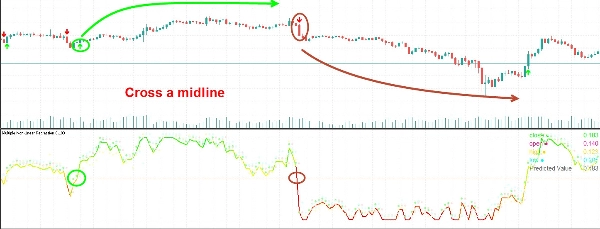
- Señales para cruces con una línea media (0.5).
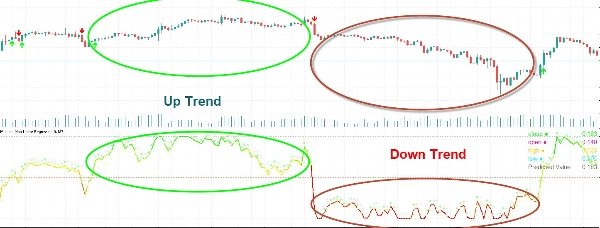
Interpretación:
Los usuarios pueden interpretar la línea de regresión y sus cruces con la línea media (0.5) como señales para posibles oportunidades de compra o venta.
Este indicador ayuda a los usuarios a analizar la relación entre múltiples variables y tomar decisiones de trading basadas en el análisis de regresión. Ajustar los coeficientes y parámetros puede afinar el rendimiento del modelo según condiciones específicas del mercado.
5 | 100 % | |
4 | 0 % | |
3 | 0 % | |
2 | 0 % | |
1 | 0 % |