
Descrição
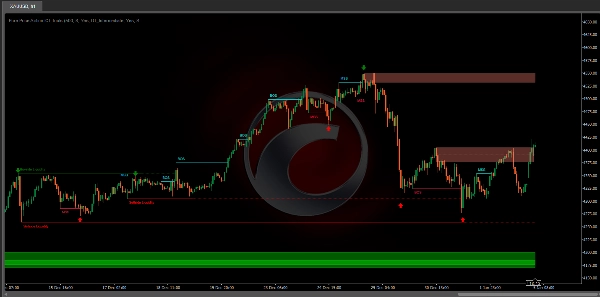
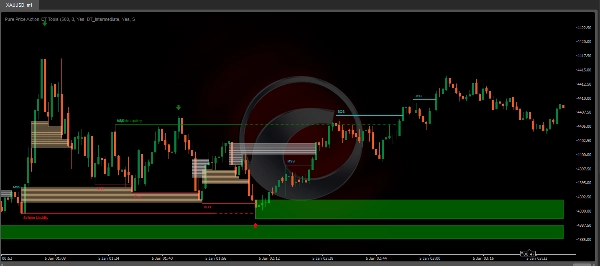
O Indicador Pure Price Action ICT Tools foi projetado para análise pura da ação do preço, identificando automaticamente estruturas de mercado em tempo real, níveis de liquidez, blocos de ordens e de quebra, e vazios de liquidez.
Sua característica única reside em sua dependência exclusiva de padrões de preço, sem estar limitado por quaisquer entradas definidas pelo usuário, garantindo uma análise robusta e objetiva da dinâmica do mercado.
Principais Características
- Estruturas de Mercado
Uma Mudança na Estrutura de Mercado, também conhecida como Mudança de Característica (CHoCH), é um evento crucial na análise da ação do preço que indica uma possível mudança no sentimento ou direção do mercado. Uma MSS ocorre quando o preço reverte de uma tendência estabelecida, sinalizando que a tendência predominante pode estar perdendo força e uma reversão pode estar em andamento. Essa mudança é frequentemente identificada por padrões técnicos chave, como uma mínima mais alta em uma tendência de baixa ou uma máxima mais baixa em uma tendência de alta, que indicam um enfraquecimento da força da tendência atual.
Uma Quebra de Estrutura geralmente indica a continuação da tendência atual do mercado. Este evento ocorre quando o preço se move decisivamente além de uma máxima ou mínima anterior, confirmando a força da tendência predominante. Em uma tendência de alta, um BOS é marcado pelo preço ultrapassando uma máxima anterior, enquanto em uma tendência de baixa, é identificado pelo preço rompendo abaixo de uma mínima anterior.
Embora uma Mudança na Estrutura de Mercado (MSS) possa indicar uma possível reversão de tendência e uma Quebra de Estrutura (BOS) frequentemente confirme a continuação da tendência, elas não garantem uma reversão ou continuação completa. Os níveis de MSS e BOS também podem funcionar como zonas de liquidez ou áreas de consolidação de preço, em vez de sinalizar definitivamente uma mudança na direção do mercado. Os traders devem abordar esses sinais com cautela e validá-los com fatores adicionais antes de tomar decisões de negociação. Para mais detalhes sobre outros componentes da ferramenta, consulte as seções seguintes.
- Blocos de Ordem & Quebra
Blocos de Ordem e Quebra são conceitos chave na análise da ação do preço que ajudam os traders a identificar níveis significativos na estrutura do mercado.
Blocos de Ordem são zonas específicas de preço onde ocorreu atividade significativa de compra ou venda. Essas zonas frequentemente representam as ações de grandes traders institucionais ou formadores de mercado, que executam ordens substanciais que impactam o mercado.
Blocos de Quebra são zonas específicas de preço onde ocorre uma forte reversão, causando uma quebra na estrutura predominante do mercado. Esses blocos indicam áreas onde o preço encontrou resistência ou suporte significativos, levando a uma reversão.
Em resumo, a liquidez do lado comprador e do lado vendedor fornece insights cruciais sobre a dinâmica da demanda e oferta do mercado, ajudando os traders a tomar decisões informadas com base na disponibilidade de ordens em diferentes níveis de preço.
- Liquidez do Lado Comprador & Vendedor
As zonas de liquidez tanto do lado comprador quanto do lado vendedor são críticas para identificar potenciais pontos de reversão no mercado. Essas zonas são onde o interesse significativo de compra ou venda está concentrado, influenciando os movimentos futuros dos preços.
Em resumo, a liquidez do lado comprador e do lado vendedor fornece insights cruciais sobre a dinâmica da demanda e oferta do mercado, ajudando os traders a tomar decisões informadas com base na disponibilidade de ordens em diferentes níveis de preço.
- Vazios de Liquidez
Vazios de liquidez são lacunas ou áreas em um gráfico de preços onde há falta de atividade de negociação. Esses vazios representam zonas com ordens de compra ou venda mínimas ou inexistentes, frequentemente resultando em movimentos bruscos de preço quando o mercado entra nessas áreas.
Em resumo, vazios de liquidez são áreas cruciais em um gráfico de preços caracterizadas pela falta de atividade de negociação. Esses vazios podem levar a movimentos rápidos de preço e aumento da volatilidade, tornando-os considerações essenciais para os traders em sua análise e processos decisórios.
- Pontos de Oscilação
Pontos de reversão de preço são comumente chamados de pontos de oscilação. Os traders frequentemente analisam pontos de oscilação históricos para discernir tendências de mercado e identificar potenciais pontos de entrada e saída de negociações.
Observe que neste script esses estão sujeitos a retro-pintura, ou seja, eles não estão localizados onde são detectados.
A detecção de pontos de oscilação e a característica única deste script dependem exclusivamente da ação do preço, eliminando a necessidade de configurações numéricas definidas pelo usuário. O processo começa com a detecção de pontos de oscilação de curto prazo:
- Máxima de Curto Prazo (STH): Identificada como um pico de preço cercado por máximas mais baixas em ambos os lados.
- Mínima de Curto Prazo (STL): Reconhecida como um vale de preço cercado por mínimas mais altas em ambos os lados.
Pontos de oscilação de médio e longo prazo são detectados usando a mesma abordagem, mas com uma ligeira modificação. Em vez de analisar diretamente as velas de preço, são utilizados os pontos de oscilação de curto prazo previamente detectados. Para pontos de oscilação de médio prazo, são analisados os pontos de curto prazo, enquanto para pontos de longo prazo, são usados os de médio prazo.
Este método garante uma análise robusta e objetiva da dinâmica do mercado, oferecendo aos traders insights confiáveis sobre estruturas de mercado. Os pontos de oscilação detectados servem como base para identificar estruturas de mercado, níveis de liquidez do lado comprador/vendedor, e blocos de ordem e quebra apresentados com esta ferramenta.
Em resumo, pontos de oscilação são elementos essenciais na análise técnica, ajudando os traders a identificar tendências, níveis de suporte e resistência, e pontos ótimos de entrada e saída. Compreender os pontos de oscilação permite que os traders tomem decisões informadas com base nos movimentos naturais de preço no mercado.
Configurações
- Estruturas de Mercado
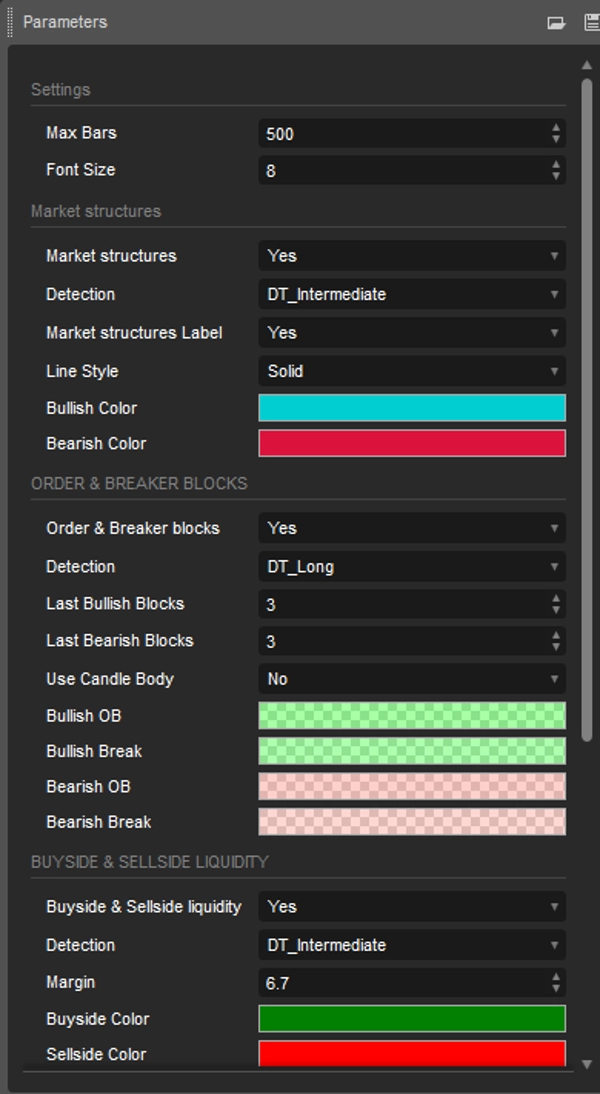
Estruturas de Mercado: Alterna a visibilidade das estruturas de mercado, tanto mudanças quanto quebras.
Detecção: Uma opção que permite aos usuários detectar estruturas de mercado com base na importância dos níveis de oscilação, incluindo curto, médio e longo prazo.
Rótulos de Estrutura de Mercado: Controla a visibilidade dos rótulos que destacam o tipo de estrutura de mercado.
Estilo da Linha: Personaliza o estilo das linhas que representam a estrutura de mercado.
- Blocos de Ordem & Quebra
Blocos de Ordem & Quebra: Alterna a visibilidade dos blocos de ordem & quebra.
Detecção: Uma opção que permite aos usuários detectar blocos de ordem & quebra com base na importância dos níveis de oscilação, incluindo curto, médio e longo prazo.
Últimos Blocos Altistas: Número dos blocos de ordem/ quebra altistas mais recentes a serem exibidos no gráfico.
Últimos Blocos Baixistas: Número dos blocos de ordem/ quebra baixistas mais recentes a serem exibidos no gráfico.
Usar Corpo da Vela: Permite aos usuários usar os corpos das velas como áreas de blocos de ordem em vez do intervalo completo da vela.
- Liquidez do Lado Comprador & Vendedor
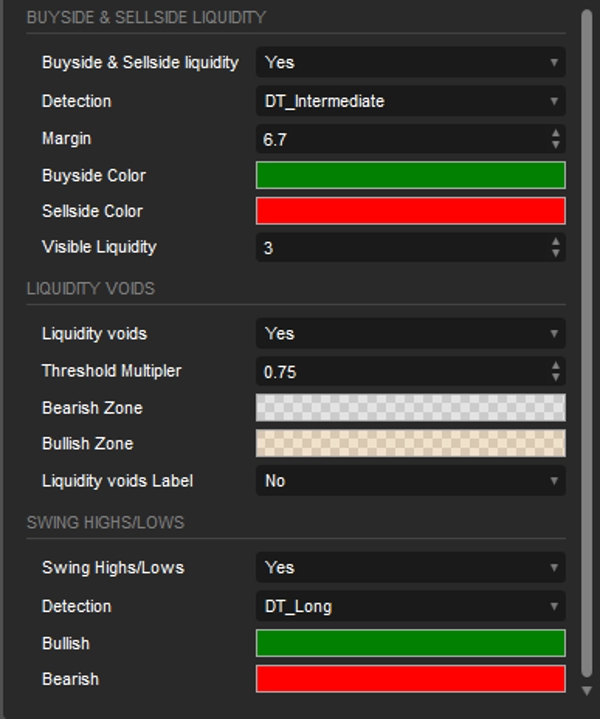
Liquidez do Lado Comprador & Vendedor: Alterna a visibilidade dos níveis de liquidez do lado comprador & vendedor.
Detecção: Uma opção que permite aos usuários detectar liquidez do lado comprador & vendedor com base na importância dos níveis de oscilação, incluindo curto, médio e longo prazo.
Margem: Define a margem/sensibilidade para a detecção de um nível de liquidez.
Liquidez Visível: Controla a quantidade dos níveis/zonas de liquidez a serem visualizados.
- Vazios de Liquidez
Vazios de Liquidez: Habilita a exibição de vazios de liquidez altistas e baixistas.
Multiplicador de Limite: Define o multiplicador para o limite, que é codificado rigidamente para o intervalo ATR de 200 períodos.
Rótulo: Habilita a exibição de um rótulo indicando vazios de liquidez.
- Pontos de Oscilação
Máximas/Mínimas de Oscilação: Alterna a visibilidade dos níveis de oscilação.
Detecção: Uma opção que permite aos usuários detectar níveis de oscilação com base na importância dos níveis de oscilação, incluindo curto, médio e longo prazo.
Resumo
Key functionalities include:
- Market Structures: Detects Market Structure Shifts (potential trend reversals) and Breaks of Structure (trend continuations) based on price patterns.
- Order & Breaker Blocks: Highlights significant price zones where institutional buying/selling or strong reversals occur.
- Buy-side & Sell-side Liquidity: Identifies zones of concentrated buying or selling interest that may influence price movements.
- Liquidity Voids: Marks price chart gaps with minimal trading activity, often leading to sharp price moves.
- Swing Points: Detects short-, intermediate-, and long-term reversal points to aid in trend analysis and trade decision-making.
The tool offers customizable settings to toggle visibility and detection sensitivity for each feature, including options to adjust detection based on swing level significance and display preferences. It supports analysis across various markets such as Forex, Crypto (e.g., BTCUSD), and indices (e.g., NAS100, XAUUSD). The indicator provides an objective framework for analyzing market dynamics based solely on price action patterns.
Avaliações de clientes
5 | 67 % | |
4 | 0 % | |
3 | 33 % | |
2 | 0 % | |
1 | 0 % |


