
Fair Value Gaps
Chỉ báo
1.03K lượt tải
Phiên bản 1.0, Dec 2025
Windows, Mac
5.0
Đánh giá: 1
Mô tả
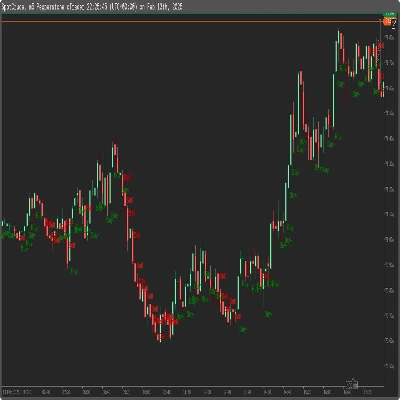
Chỉ Báo Khoảng Trống Giá Hợp Lý (FVG)
Tổng Quan
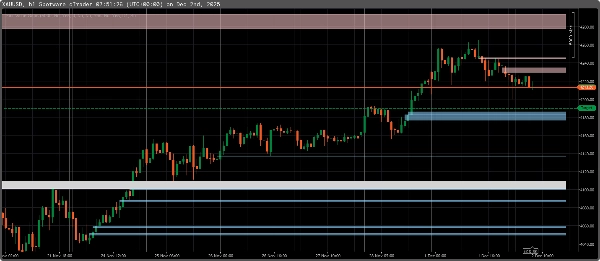
Chỉ báo Khoảng Trống Giá Hợp Lý (FVG) xác định các điểm không hiệu quả trong hành động giá khi xảy ra sự mất cân bằng do mua hoặc bán mạnh mẽ. Những khoảng trống này thường được tạo ra bởi các nhà giao dịch tổ chức và tiền thông minh, để lại những vùng mà giá có thể quay lại "lấp đầy" sự mất cân bằng trước khi tiếp tục xu hướng.
Các Tính Năng Chính:
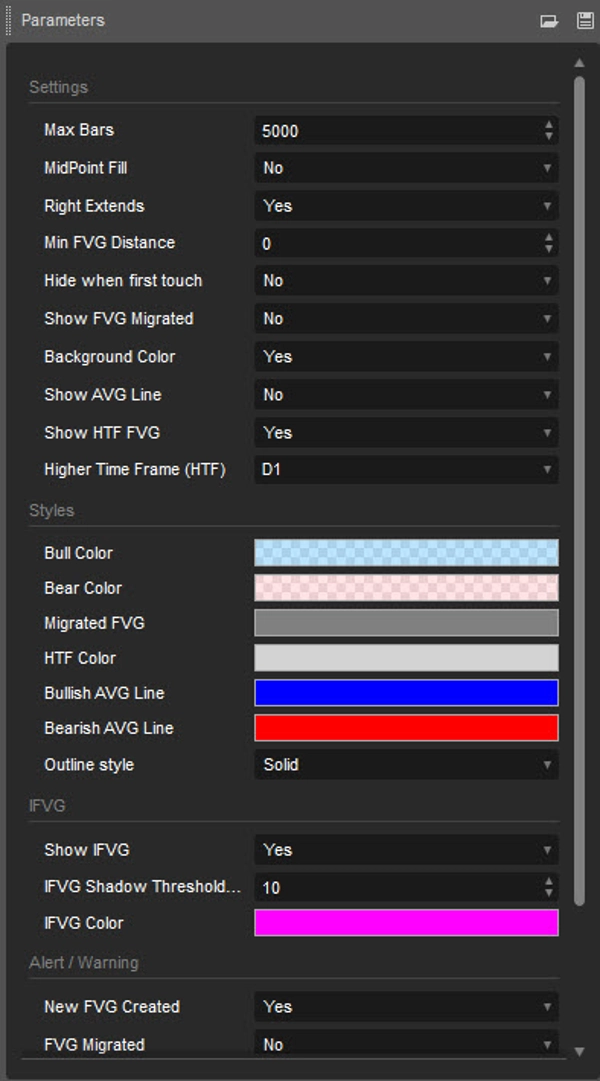
- Phát Hiện Tự Động FVG – Chỉ báo làm nổi bật các khoảng trống giá hợp lý trên các khung thời gian khác nhau.
- Hỗ Trợ Đa Khung Thời Gian – Xem các FVG từ khung thời gian cao hơn trên biểu đồ khung thời gian thấp hơn.
Cách Hoạt Động:
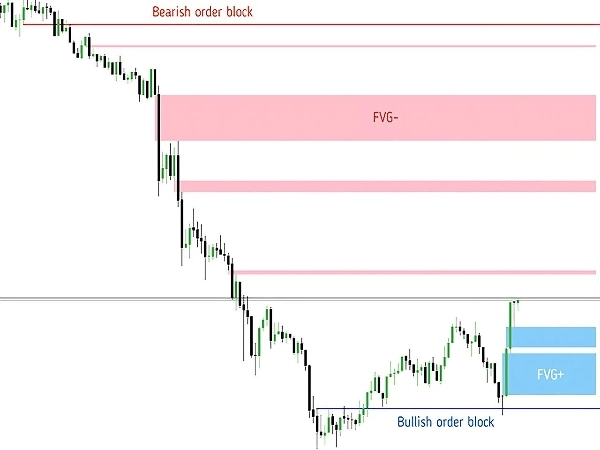
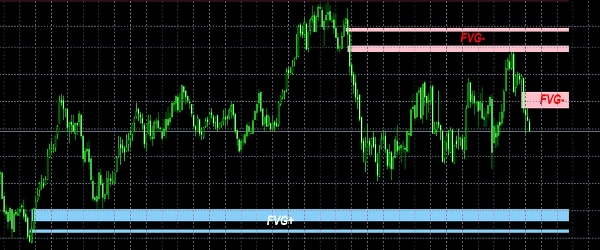
- Chỉ báo quét các chuyển động giá và phát hiện các khoảng trống nơi đỉnh của một cây nến không chồng lấp với đáy của hai cây nến tiếp theo (FVG tăng giá) hoặc ngược lại (FVG giảm giá).
- Những vùng này được đánh dấu như các khu vực thanh khoản tiềm năng nơi giá có thể quay lại trước khi tiếp tục theo xu hướng chính.
- Chỉ báo giúp các nhà giao dịch nhận diện dấu vết tiền thông minh, kết hợp FVG với BOS, CHoCH và các Khối Lệnh.
Cách Giao Dịch Sử Dụng FVG:
- Chiến Lược Vào Lệnh: Chờ giá quay lại và phản ứng với vùng FVG (bị từ chối, hỗ trợ hoặc kháng cự).
- Giao Dịch Kết Hợp: Kết hợp với BOS, Khối Lệnh và Quét Thanh Khoản để tăng độ chính xác.
- Mục Tiêu Chốt Lời: Xem xét khu vực thanh khoản tiếp theo hoặc mức cấu trúc chính.
Ai Nên Sử Dụng Chỉ Báo Này?
- Nhà Giao Dịch Tiền Thông Minh & ICT
- Nhà Giao Dịch Hành Động Giá & Tổ Chức
- Nhà Giao Dịch Lướt Sóng & Swing
Tóm tắt
Tóm tắt AI
The Fair Value Gap (FVG) Indicator detects price action inefficiencies caused by aggressive buying or selling, often linked to institutional traders. It automatically identifies fair value gaps—areas where a candle’s high does not overlap with the low of two candles ahead (bullish FVG) or vice versa (bearish FVG)—across multiple timeframes, allowing users to view higher timeframe gaps on lower timeframe charts. These gaps represent potential liquidity zones where price may revisit before continuing its trend. The indicator helps traders recognize smart money footprints by combining FVG analysis with Break of Structure (BOS), Change of Character (CHoCH), and Order Blocks. Trading strategies using this indicator involve waiting for price reactions at FVG zones for entry, using confluence with other smart money concepts for accuracy, and targeting subsequent liquidity pools or major structure levels for take profit. It is suitable for smart money, ICT, price action, institutional traders, scalpers, and swing traders operating in markets including Forex, Crypto, and indices such as BTCUSD, EURUSD, XAUUSD, and NAS100.
Hồ sơ chỉ báo
Đánh giá của khách hàng
5.0
Đánh giá: 1
5 | 100 % | |
4 | 0 % | |
3 | 0 % | |
2 | 0 % | |
1 | 0 % |
Đánh giá của khách hàng
December 10, 2025
A clean and accurate Fair Value Gap detector. Highlights bullish/bearish FVGs with minimal lag and great clarity. Useful for intraday and swing ICT/SMC setups. Can get busy on lower TFs, but filtering helps. Alerts, MTF mode and FVG state tracking would take it to the next level.
Thảo luận
Câu hỏi thường gặp
BTCUSD
Forex
Scalping
EURUSD
Fair Value Gap
SMC
Crypto
XAUUSD
NAS100
Các sản phẩm có sẵn trên cTrader Store, bao gồm bot giao dịch, chỉ báo và plugin, được cung cấp bởi các nhà phát triển bên thứ ba và chỉ nhằm mục đích cung cấp thông tin và tiếp cận kỹ thuật. cTrader Store không phải là nhà môi giới và không cung cấp lời khuyên đầu tư, khuyến nghị cá nhân hay bất kỳ đảm bảo nào về hiệu suất trong tương lai.


Giá
38
Lượt bán
2.38K
Cài đặt miễn phí