
Mô tả
Hull Moving Average Colored – Hướng Xu Hướng Trong Nháy Mắt
Tổng Quan
Hull Moving Average Colored là một chỉ báo theo xu hướng đơn giản hóa, kết hợp độ nhạy của Hull Moving Average với các tín hiệu hướng đi được mã hóa màu sắc. Bằng cách hiển thị xu hướng tăng bằng màu xanh lá và xu hướng giảm bằng màu đỏ, nó cung cấp xác nhận trực quan ngay lập tức về hướng động lượng mà không cần phân tích phức tạp.
Nó Làm Gì
Nền Tảng Hull Moving Average: Chỉ báo sử dụng Hull Moving Average (HMA), một trung bình động phản ứng nhanh được thiết kế để giảm độ trễ trong khi vẫn giữ được sự mượt mà. Khác với các trung bình động truyền thống, HMA ưu tiên hành động giá gần đây, làm cho nó đặc biệt hữu ích để bắt kịp các thay đổi xu hướng sớm.
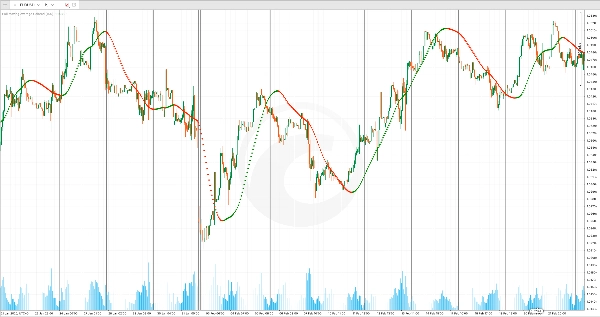
Trực Quan Hóa Xu Hướng Mã Hóa Màu: Thay vì một đường đơn, chỉ báo vẽ các điểm hướng đi:
- Điểm Màu Xanh Lá: Xuất hiện khi HMA đang tăng, chỉ ra động lượng đi lên
- Điểm Màu Đỏ: Xuất hiện khi HMA đang giảm, chỉ ra động lượng đi xuống
Hệ thống màu nhị phân này làm cho hướng xu hướng trở nên rõ ràng ngay lập tức — không cần phải giải thích độ dốc hay so sánh với các thanh trước.
Các Tính Năng Chính
Hiển Thị Chồng Lên: Chỉ báo được vẽ trực tiếp trên biểu đồ giá của bạn, cho phép bạn thấy hướng xu hướng liên quan đến các mức giá thực tế. Điều này giúp dễ dàng nhận biết khi giá phá vỡ lên trên hoặc xuống dưới trung bình động, báo hiệu các điểm vào và thoát tiềm năng.
Giảm Độ Trễ Phản Ứng: Hull Moving Average phản ứng nhanh hơn so với các trung bình động hàm mũ hoặc đơn giản tiêu chuẩn, làm cho nó đặc biệt hiệu quả cho các nhà giao dịch swing và giao dịch trong ngày cần tín hiệu kịp thời mà không bị nhiễu quá nhiều.
Tùy Chỉnh Đơn Giản: Điều chỉnh tham số Period để kiểm soát độ nhạy. Các khoảng thời gian ngắn hơn (ví dụ: 20-32) làm cho chỉ báo phản ứng nhanh hơn với các biến động gần đây nhưng dễ bị tín hiệu sai trong thị trường biến động mạnh. Các khoảng thời gian dài hơn (ví dụ: 64-128) cung cấp xu hướng mượt mà hơn với ít tín hiệu sai hơn nhưng có thể bỏ lỡ các đảo chiều nhanh.
Ứng Dụng Thực Tiễn
Sử dụng Hull Moving Average Colored như một bộ lọc nhanh cho hướng giao dịch. Chỉ thực hiện các giao dịch mua khi các điểm màu xanh lá xuất hiện và giá nằm trên trung bình; chỉ thực hiện các giao dịch bán khi các điểm màu đỏ xuất hiện và giá nằm dưới trung bình. Ngược lại, xem các thay đổi màu sắc như tín hiệu thoát tiềm năng — khi màu xanh chuyển sang đỏ, đó là lúc bạn nên đánh giá lại các vị thế mua của mình.
Chỉ báo hoạt động tốt trong các thị trường có xu hướng và đặc biệt hữu ích trên các khung thời gian cao hơn (4 giờ và hàng ngày) nơi nó có thể giúp bạn đồng bộ với xu hướng chung trước khi giao dịch các thiết lập trên khung thời gian thấp hơn.
Tóm tắt
This indicator overlays directly on price charts and uses a binary color system to indicate trend direction: green points appear when the HMA is rising, signaling upward momentum, and red points appear when the HMA is falling, signaling downward momentum. This visual approach allows traders to quickly identify trend direction without interpreting slopes or comparing previous bars.
Users can adjust the period parameter to control sensitivity—shorter periods increase responsiveness but may generate more false signals, while longer periods smooth trends but may delay signals. The indicator is suitable for various markets including Forex, indices, stocks, and cryptocurrencies such as BTCUSD and XAUUSD. It is particularly useful on higher timeframes (4-hour and daily) for aligning with broader market trends and can assist in identifying potential entry and exit points based on trend changes.
Đánh giá của khách hàng
5 | 0 % | |
4 | 100 % | |
3 | 0 % | |
2 | 0 % | |
1 | 0 % |


![Logo "[Hamster-Coder] Bollinger Bands"](https://cdn.ctrader.com/image/webp/21d8e5d6-fb11-4bac-b9ee-cd05c2b76804_30327)


