
Opis
Wskaźnik Quantitative Qualitative Estimation (QQE) Multi-Timeframe
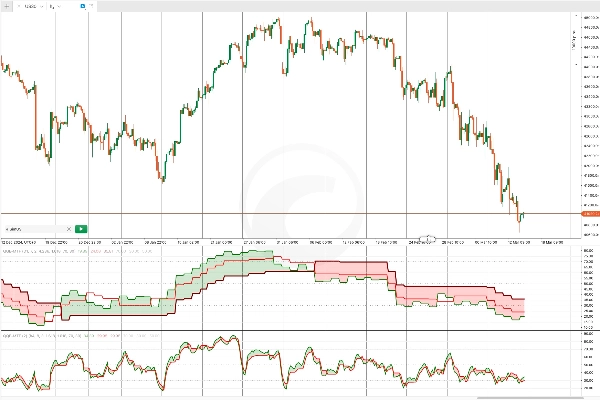
Wskaźnik Quantitative Qualitative Estimation (QQE) to narzędzie analizy technicznej, które ulepsza Relative Strength Index (RSI) poprzez zastosowanie wygładzonych średnich kroczących. Pomaga traderom ocenić siłę trendu, potencjalne odwrócenia oraz stany wykupienia/wyprzedania z większą dokładnością.
QQE posiada dwa kluczowe elementy: szybkie i wolne poziomy trailing stop, które działają jako dynamiczne wsparcie i opór. Czyni to z niego wszechstronne narzędzie zarówno dla strategii podążania za trendem, jak i strategii powrotu do średniej. Przecięcie linii QQE z linią sygnałową często wskazuje na potencjalne możliwości kupna lub sprzedaży.
Multi-Timeframe QQE: Zaawansowana wersja
Ta ulepszona wersja wskaźnika QQE została zaprojektowana jako narzędzie wielookresowe, integrujące zarówno szybkie, jak i wolne linie trendu dla lepszej precyzji. Analizując ruch cen na wielu ramach czasowych, dostarcza kompleksowy obraz trendów rynkowych.
Jego zaawansowany algorytm wygładzania zwiększa niezawodność, czyniąc go skutecznym samodzielnym wskaźnikiem do:
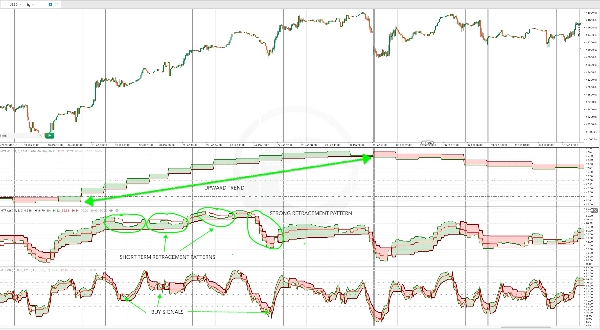
✅ Identyfikacji kierunku trendu
✅ Generowania precyzyjnych sygnałów wejścia i wyjścia
✅ Wykrywania stanów wykupienia i wyprzedania
Elastyczność Multi-Timeframe QQE sprawia, że nadaje się on zarówno do strategii podążania za trendem, jak i odwrócenia.
Jak korzystać z Multi-Timeframe QQE
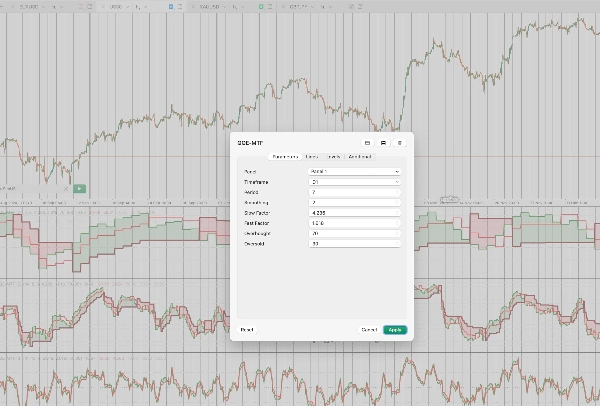
Aby skonfigurować Multi-Timeframe QQE, traderzy muszą wybrać:
🔹 Ramę czasową (np. Daily, H4, H1)
🔹 Okresy (liczba świec używanych w obliczeniach)
🔹 Okres wygładzania (do wygładzania RSI)
🔹 Wolne i szybkie czynniki (do regulacji czułości)
🔹 Dostosowywalne poziomy wykupienia i wyprzedania
📌 Uwaga: Ponieważ jest to wskaźnik wielookresowy, po dodaniu go do wykresu ważne jest, aby oddalić widok w interfejsie cTrader, aby umożliwić załadowanie wystarczającej ilości danych i prawidłową inicjalizację wskaźnika.
Strategie handlowe z Multi-Timeframe QQE
1️⃣ QQE do potwierdzenia trendu na wyższej ramie czasowej
Jednym ze skutecznych sposobów wykorzystania Multi-Timeframe QQE jest potwierdzenie trendu na wyższej ramie czasowej przy jednoczesnym identyfikowaniu wejść na korektach na niższej ramie czasowej.
Na przykład:
- Wskaźnik QQE na dziennej ramie czasowej służy do potwierdzenia silnego trendu.
- Wejścia na korektach są następnie identyfikowane, gdy Oscylator Stochastyczny przecina poziomy wykupienia lub wyprzedania.
Ta metoda pomaga traderom dopasować swoje wejścia do ogólnego trendu.
2️⃣ Analiza wielookresowa dla głębszych wglądów w rynek
Korzystanie z QQE na wielu ramach czasowych pozwala traderom uzyskać bardziej szczegółowe zrozumienie zachowania aktywów.
Na przykład, stosując QQE na:
📊 ramie dziennej (D1): Określa ogólny kierunek trendu.
📊 ramie 4-godzinnej (H4): Potwierdza kierunek trendu i identyfikuje krótkoterminowe cofnięcia.
📊 ramie 1-godzinnej (H1): Generuje precyzyjne sygnały wejścia na podstawie stanów wykupienia/wyprzedania lub ruchów przeciwnych do trendu.
Takie uporządkowane podejście poprawia timing transakcji i podejmowanie decyzji poprzez synchronizację sygnałów na różnych ramach czasowych.
Podsumowanie
This advanced multi-timeframe tool integrates fast and slow trend lines to analyze price action across different timeframes, providing a comprehensive view of market trends. Its smoothing algorithm improves reliability, making it effective for identifying trend direction, generating precise entry and exit signals, and detecting overbought/oversold levels.
Users configure the indicator by selecting a timeframe (e.g., Daily, H4, H1), periods for calculation, smoothing period for RSI, sensitivity factors, and customizable overbought/oversold thresholds. It is recommended to zoom out in the cTrader interface after adding the indicator to allow sufficient data loading.
Typical strategies include using the QQE on higher timeframes for trend confirmation and on lower timeframes for entry timing, as well as multi-timeframe analysis to enhance trade timing and decision-making by aligning signals across timeframes.
Opinie klientów
5 | 50 % | |
4 | 50 % | |
3 | 0 % | |
2 | 0 % | |
1 | 0 % |


