
Mô tả
Khoảng trống mở cửa hàng tuần & hàng ngày — Chỉ báo NWOG & NDOG
Hiển thị khoảng trống mở cửa chuyên nghiệp dành cho các nhà giao dịch tổ chức và người tham gia bán lẻ nghiêm túc
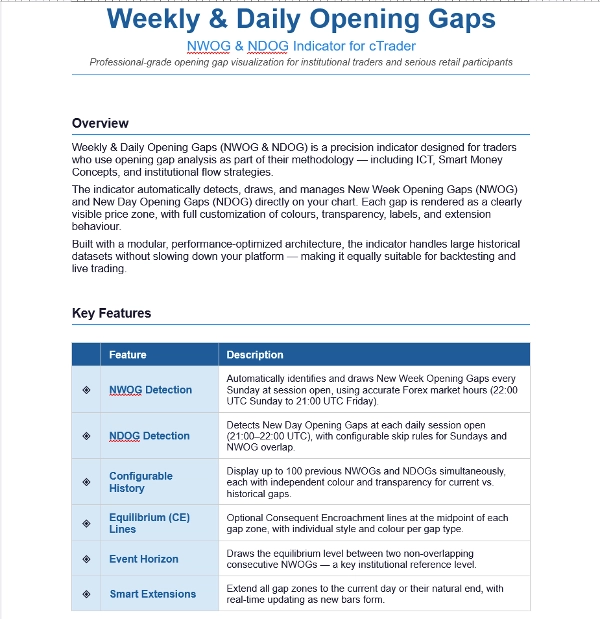
TỔNG QUAN
Khoảng trống mở cửa hàng tuần & hàng ngày (NWOG & NDOG) là một chỉ báo chính xác được thiết kế cho các nhà giao dịch sử dụng phân tích khoảng trống mở cửa như một phần trong phương pháp của họ — bao gồm ICT, Khái niệm Tiền Thông minh và các chiến lược dòng chảy tổ chức.
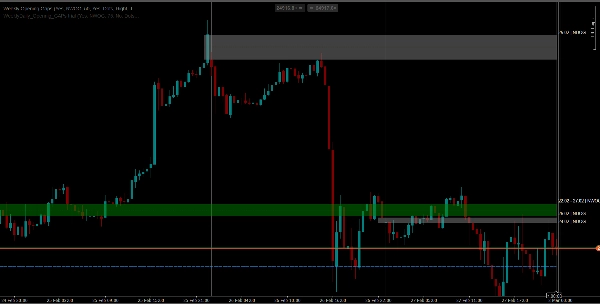
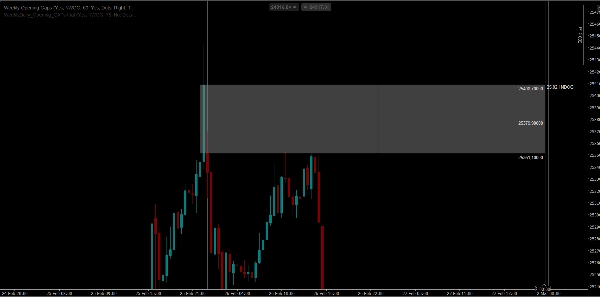
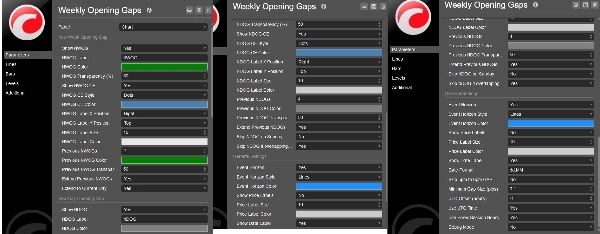
Chỉ báo tự động phát hiện, vẽ và quản lý Khoảng trống Mở Cửa Tuần Mới (NWOG) và Khoảng trống Mở Cửa Ngày Mới (NDOG) trực tiếp trên biểu đồ của bạn. Mỗi khoảng trống được hiển thị như một vùng giá rõ ràng, với khả năng tùy chỉnh đầy đủ về màu sắc, độ trong suốt, nhãn và hành vi mở rộng.
Được xây dựng với kiến trúc mô-đun, tối ưu hiệu suất, chỉ báo xử lý các bộ dữ liệu lịch sử lớn mà không làm chậm nền tảng của bạn — làm cho nó phù hợp cho cả kiểm tra lại và giao dịch trực tiếp.
TÍNH NĂNG CHÍNH
◈ Phát hiện NWOG
◈ Phát hiện NDOG với các quy tắc bỏ qua có thể cấu hình cho Chủ nhật và chồng lấp NWOG.
◈ Lịch sử có thể cấu hình — Hiển thị lên đến 100 NWOG trước đó
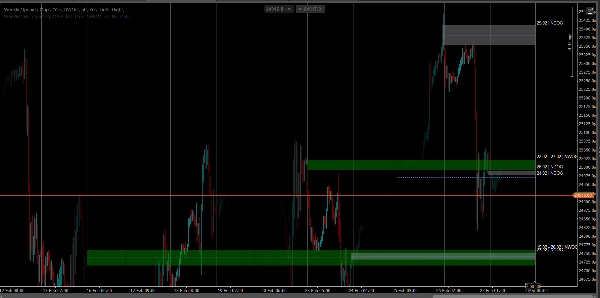
◈ Đường Cân bằng (CE)
◈ Chân trời sự kiện — Vẽ mức cân bằng giữa hai NWOG liên tiếp không chồng lấp
◈ Mở rộng thông minh — Mở rộng tất cả các vùng khoảng trống đến ngày hiện tại hoặc kết thúc tự nhiên của chúng, với cập nhật thời gian thực khi các thanh mới hình thành.
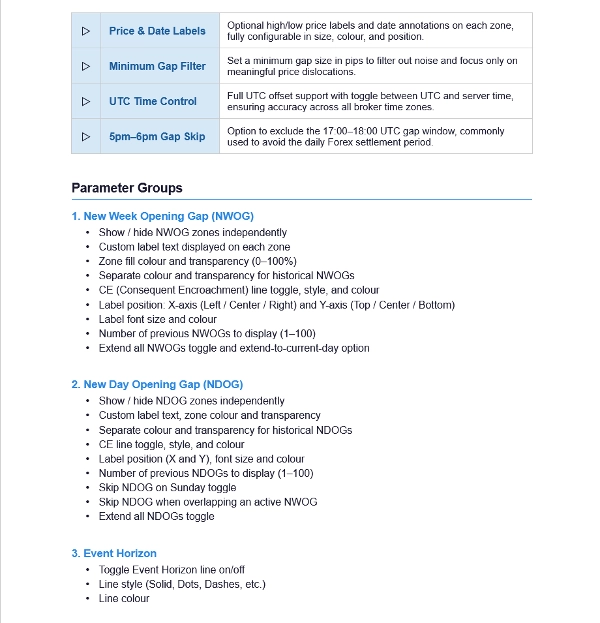
◈ Nhãn Giá & Ngày
◈ Bộ lọc khoảng trống tối thiểu
◈ Kiểm soát thời gian UTC
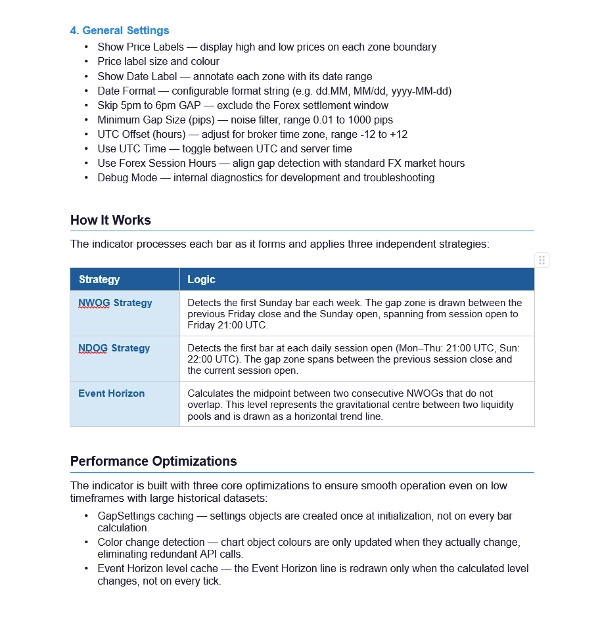
CÁCH HOẠT ĐỘNG
Chiến lược NWOG — Phát hiện thanh Chủ nhật đầu tiên mỗi tuần. Vùng khoảng trống được vẽ giữa giá đóng cửa thứ Sáu trước đó và giá mở cửa Chủ nhật, kéo dài từ giờ mở cửa phiên đến 21:00 UTC thứ Sáu.
Chiến lược NDOG — Phát hiện thanh đầu tiên tại mỗi phiên mở cửa hàng ngày (Thứ Hai–Thứ Năm: 21:00 UTC, Chủ nhật: 22:00 UTC). Vùng khoảng trống kéo dài giữa giá đóng cửa phiên trước và giá mở cửa phiên hiện tại.
Chân trời sự kiện — Tính toán điểm giữa giữa hai NWOG liên tiếp không chồng lấp. Mức này đại diện cho trung tâm hấp dẫn giữa hai nhóm thanh khoản và được vẽ dưới dạng đường xu hướng ngang.
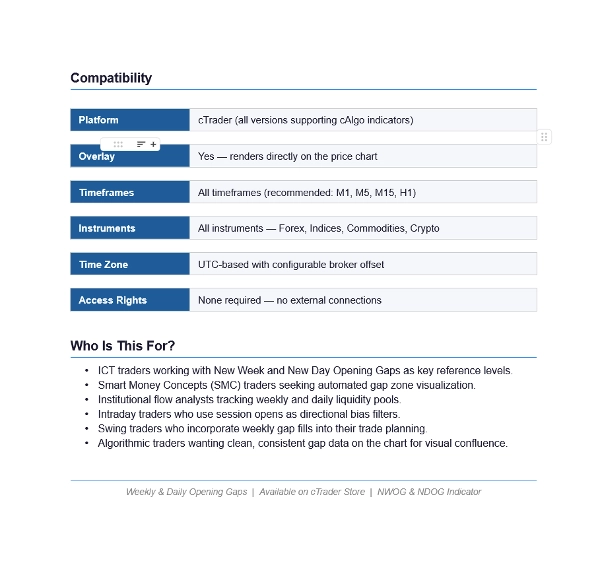
TƯƠNG THÍCH
Nền tảng: cTrader (tất cả các phiên bản hỗ trợ chỉ báo cAlgo)
Chồng lên: Có — hiển thị trực tiếp trên biểu đồ giá
Khung thời gian: Tất cả khung thời gian (khuyến nghị: M1, M5, M15, H1)
Công cụ: Tất cả — Forex, Chỉ số, Hàng hóa, C
DÀNH CHO AI?
Các nhà giao dịch ICT làm việc với Khoảng trống Mở Cửa Tuần Mới và Ngày Mới như các mức tham chiếu chính
Các nhà giao dịch Khái niệm Tiền Thông minh (SMC) tìm kiếm hiển thị tự động vùng khoảng trống
Các nhà phân tích dòng chảy tổ chức theo dõi các nhóm thanh khoản hàng tuần và hàng ngày
Các nhà giao dịch trong ngày sử dụng giờ mở cửa phiên như bộ lọc xu hướng định hướng
Các nhà giao dịch Swing tích hợp việc lấp đầy khoảng trống hàng tuần vào kế hoạch giao dịch của họ
Các nhà giao dịch thuật toán muốn dữ liệu khoảng trống sạch, nhất quán trên biểu đồ để hội tụ trực quan
Tóm tắt
Đánh giá của khách hàng
5 | 0 % | |
4 | 100 % | |
3 | 0 % | |
2 | 0 % | |
1 | 0 % |


