
Half Trend BT
Indicador
38 compras
Versión 1.0, Mar 2025
Windows, Mac
4.3
Valoraciones: 3
Descripción
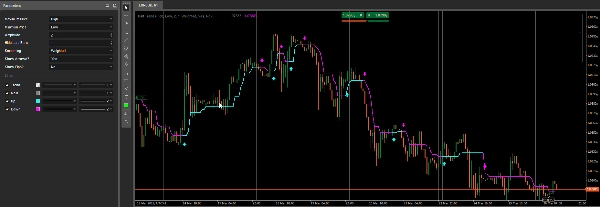
El indicador Half Trend está diseñado para detectar y resaltar posibles reversiones de tendencia comparando los máximos y mínimos recientes durante un período especificado, y luego trazando una línea de “Subida” o “Bajada” en consecuencia. Opcionalmente, dibuja flechas en cada cambio de tendencia y puede mostrar las diferencias en pips entre señales.
- Selección de Series de Máximos/Mínimos
- El indicador utiliza dos series de precios (Máximo y Mínimo por defecto) para rastrear los máximos y mínimos locales.
- Puedes seleccionar diferentes tipos de precios (por ejemplo,
Open,Close,Median, etc.) para cada serie a través de Maximum Price y Minimum Price.
- Promedios Móviles y Cálculo del Período
- Se aplica un promedio móvil (basado en el tipo de Smoothing elegido y el período de Amplitude) a ambas series de precios “máximo” y “mínimo” seleccionadas.
- El indicador compara los precios de la barra actual con estos niveles suavizados de máximo/mínimo para decidir si cambiar de una tendencia alcista a una bajista (o viceversa).
- Detección y Trazado de Tendencias
- Si el indicador identifica una tendencia alcista, traza la línea Up (cian) y establece
Trenden+1. - Si detecta una tendencia bajista, traza la línea Down (magenta) y establece
Trenden-1. - La salida Main (gris) se actualiza internamente para reflejar los niveles actuales de soporte/resistencia.
Trendes una serie de salida invisible que almacena numéricamente la dirección de la tendencia (+1o-1).
- Si el indicador identifica una tendencia alcista, traza la línea Up (cian) y establece
- Flechas y Cálculo de Pips
- ¿Mostrar Flechas? – Si está habilitado, el indicador dibuja una flecha en cada nueva barra donde se detecta una reversión de tendencia.
- ¿Mostrar Pips? – Si está habilitado, calcula y muestra la diferencia en pips entre la última señal y la nueva señal, dibujando una pequeña etiqueta y una línea de tendencia en el gráfico.
Resumen
Resumen de IA
The Half Trend BT indicator detects potential trend reversals by analyzing recent highs and lows over a specified period. It compares two selected price series—typically High and Low, but configurable to other price types such as Open, Close, or Median—using moving averages based on chosen smoothing methods and amplitude periods. The indicator plots an "Up" line (cyan) when an uptrend is detected and a "Down" line (magenta) for a downtrend, while internally storing trend direction numerically (+1 or -1). A main output line (gray) reflects current support and resistance levels. Optional features include drawing arrows on bars where trend reversals occur and calculating pip differences between signals, which are displayed as labels and trendlines on the chart. This indicator supports multiple markets including Forex, indices, commodities, cryptocurrencies, and stocks.
Perfil del indicador
Valoraciones de clientes
4.3
Valoraciones: 3
5 | 33 % | |
4 | 67 % | |
3 | 0 % | |
2 | 0 % | |
1 | 0 % |
Valoraciones de clientes
March 29, 2025
Clean idea for traders around chart reading. The useful part is adding confirmation before a trade, with the numbers checked before scaling. The cleaner reads should hold across 3 sessions, not just 1 good chart. It is stronger when a 1.5R target is realistic before the entry.
March 28, 2025
March 28, 2025
Decent tool for testing if the trader wants it makes market context easier to scan. It works best as support, not a final decision maker. I would test it on 2 timeframes, 20 signals and a 1R stop plan. it should not be used as a blind entry trigger.
Conversación
Preguntas frecuentes
Prop
Forex
Signal
Indices
Commodities
Crypto
Stocks
Los productos disponibles a través de cTrader Store, incluidos bots, indicadores y plugins para operar, son proporcionados por desarrolladores de terceros y están disponibles únicamente con fines informativos y de acceso técnico. cTrader Store no es un bróker, por lo que no proporciona asesoramiento de inversión, recomendaciones personales ni ninguna garantía de rentabilidad futura.


![Logotipo de "High-Low Divergence [Iridio Capital]"](https://cdn.ctrader.com/image/webp/443c4661-7abb-40f1-842f-4b6ec560649b_40914)


Precio
48
Ventas
1.04K
Instalaciones gratis