

Descripción
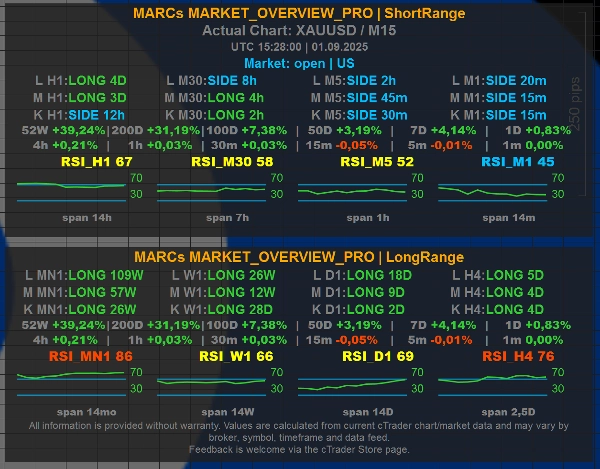
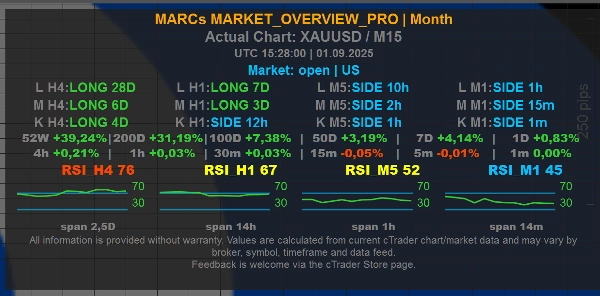
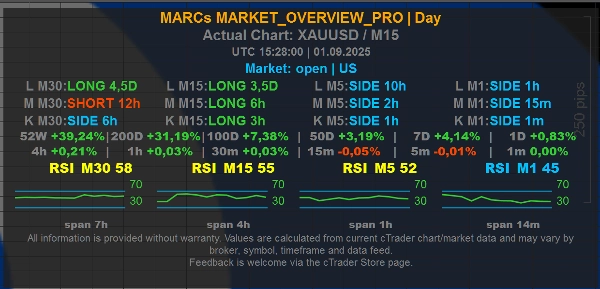
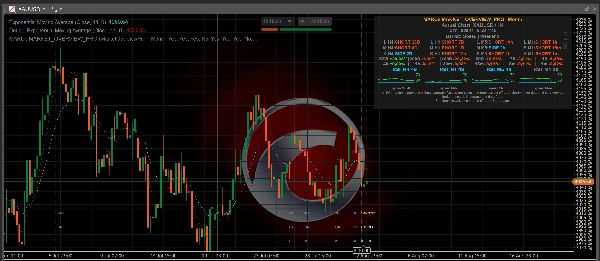
MARCs MARKET_OVERVIEW_Pro es un indicador de visión general del mercado en múltiples marcos temporales para cTrader.
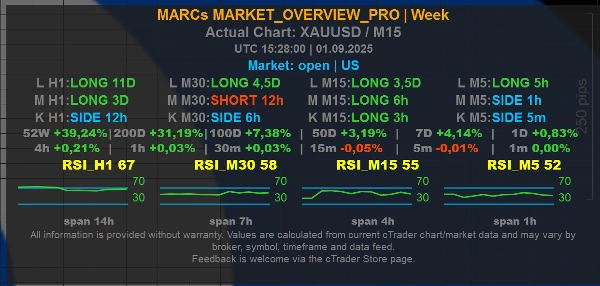
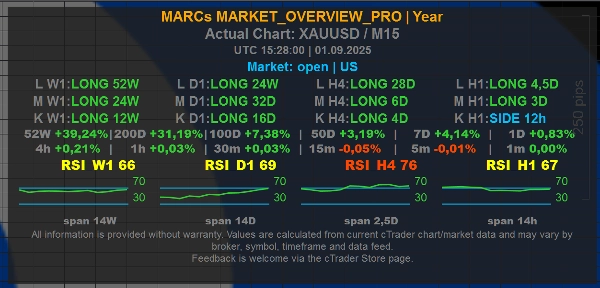
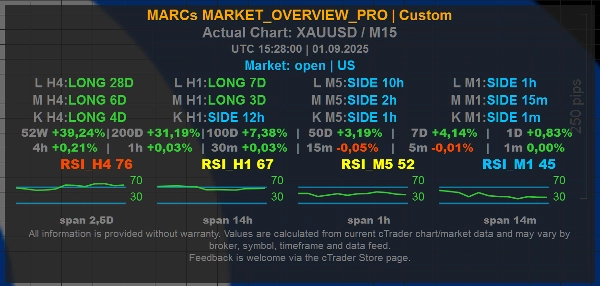
Muestra un panel compacto en el gráfico con contexto de tendencia, lecturas RSI, información del mercado/sesión y preajustes configurables de horizonte temporal. El indicador fue desarrollado originalmente para el análisis de XAUUSD / Oro, pero está diseñado para funcionar como una herramienta general de visión general del mercado en cualquier símbolo de gráfico disponible, dependiendo de la calidad de los datos del corredor y el historial de mercado disponible.
Características principales:
- Filas de tendencia en múltiples marcos temporales para contexto de mercado corto, medio y largo
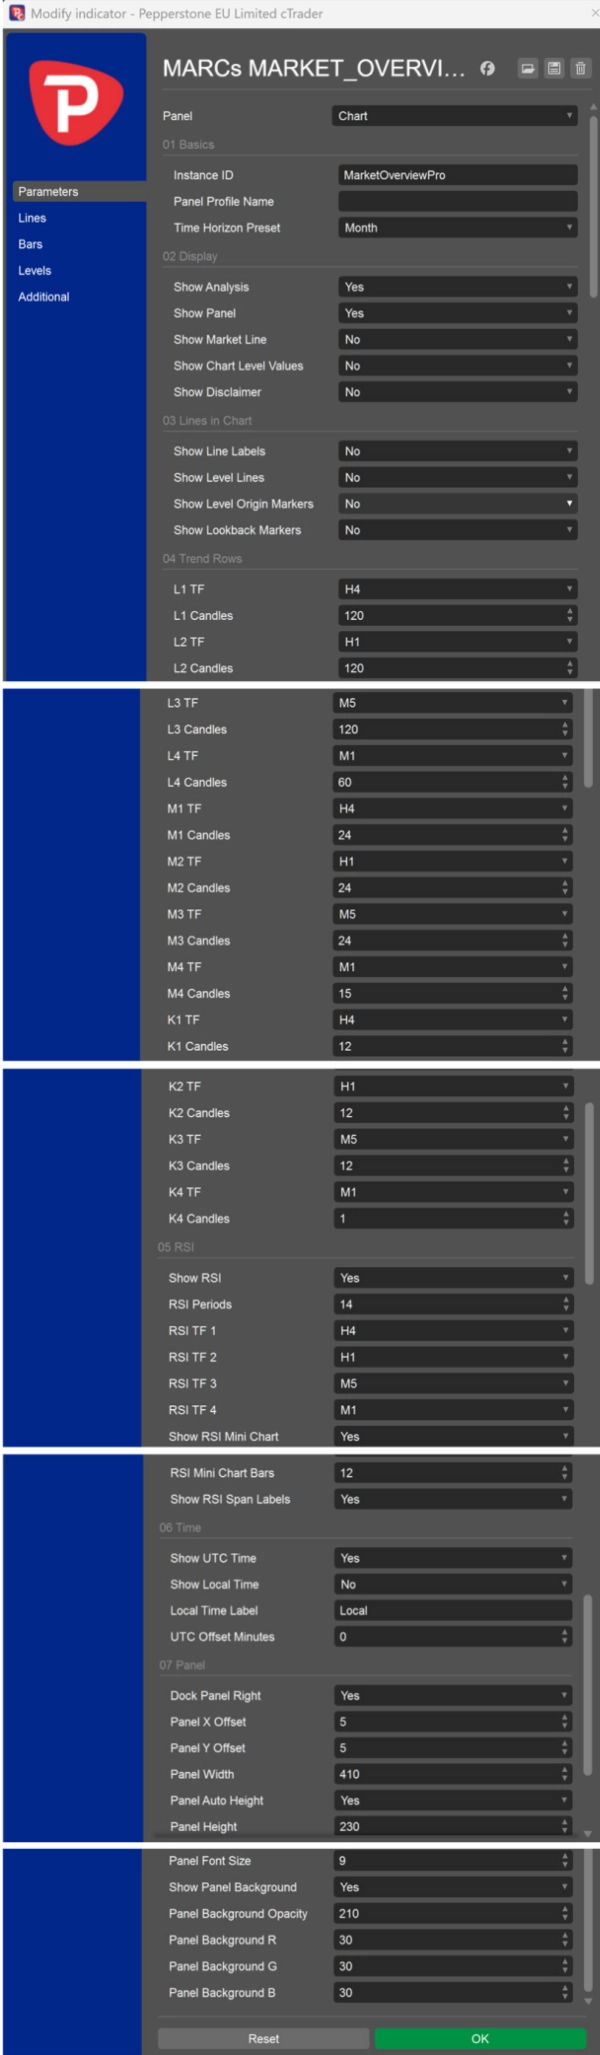
- Preajustes configurables de Día, Semana, Mes, Año, RangoCorto, RangoLargo y Personalizado
- Valores RSI y mini gráficos RSI en los marcos temporales seleccionados
- Visualización opcional de hora UTC y local
- Línea opcional de mercado/sesión
- Líneas de referencia opcionales a nivel de gráfico
- Valores opcionales a nivel de gráfico mostrados directamente en el panel
Líneas de Nivel y Valores a Nivel de Gráfico:
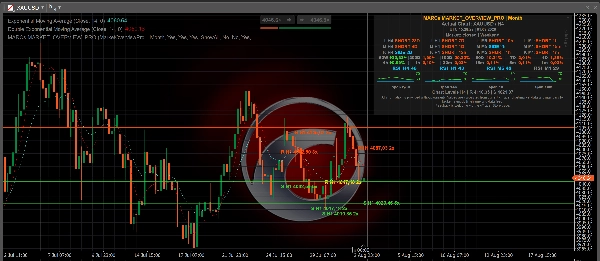
La configuración opcional Mostrar Líneas de Nivel puede mostrar niveles de referencia calculados del gráfico desde un marco temporal seleccionado: M1, M5, M15, M30, H1, H4, D1, W1 o MN1. Para estas selecciones individuales de marco temporal, el indicador muestra la resistencia calculada más cercana por encima del precio actual y el soporte calculado más cercano por debajo del precio actual. MostrarTodo muestra el conjunto de niveles H1 más amplio a partir del cálculo de nivel H1 existente. No mantiene las líneas de nivel ocultas.
La configuración opcional Mostrar Valores a Nivel de Gráfico puede mostrar los mismos valores de referencia de resistencia/soporte más cercanos directamente en el panel sin dibujar líneas en el gráfico. La línea del panel está etiquetada, por ejemplo, "Niveles de Gráfico H1 | R ... | S ..." para dejar claro que los valores se refieren a referencias a nivel de gráfico.
Cómo se calculan las Líneas de Nivel:
Los niveles se derivan de máximos y mínimos oscilantes pasados en el marco temporal seleccionado. Los puntos oscilantes cercanos se agrupan en clústeres de nivel, y solo se muestran áreas con suficientes toques repetidos. Esto hace que las líneas sean marcadores visuales de contexto de mercado basados en el historial disponible del gráfico.
Importante:
MARCs Market Overview Pro es una herramienta de visión general del mercado solo para análisis. No realiza operaciones, no gestiona posiciones, no proporciona asesoramiento de inversión ni garantiza resultados comerciales.
Las Líneas de Nivel no son señales de compra, señales de venta, recomendaciones de stop-loss, recomendaciones de toma de ganancias ni asesoramiento de inversión. No predicen que el precio se revertirá, romperá o reaccionará en un nivel específico.
Todas las lecturas dependen de los datos disponibles del gráfico cTrader, la alimentación de símbolos del corredor, el marco temporal y el historial del mercado. Los valores pueden diferir entre corredores, símbolos y fuentes de datos.
El trading implica riesgos. El rendimiento pasado no garantiza resultados futuros.
NOTA DE TRANSPARENCIA
Este indicador fue desarrollado con la ayuda de herramientas basadas en IA.
Resumen
The indicator supports optional display of UTC and local times, market/session lines, and chart-level reference lines. These reference lines represent calculated support and resistance levels derived from clusters of past swing highs and lows on selected timeframes ranging from 1 minute to monthly intervals. Users can choose to show these levels as lines on the chart or as numeric values within the dashboard panel.
Originally developed with a focus on XAUUSD (Gold), MARCs MARKET_OVERVIEW_Pro is adaptable to any chart symbol supported by the broker’s data feed and market history. It serves as an analysis tool providing visual market structure and momentum insights but does not execute trades or offer trading advice. The indicator’s readings depend on the quality and availability of broker data and chart history.
Conversación
Valoraciones de clientes
Preguntas frecuentes
Más de este autor
















![Logotipo de "[Stellar Strategies] Inside Bar with Signals"](https://cdn.ctrader.com/image/webp/1d9e8bfa-3b2c-4440-bb37-5856902008a7_30683)


Precio