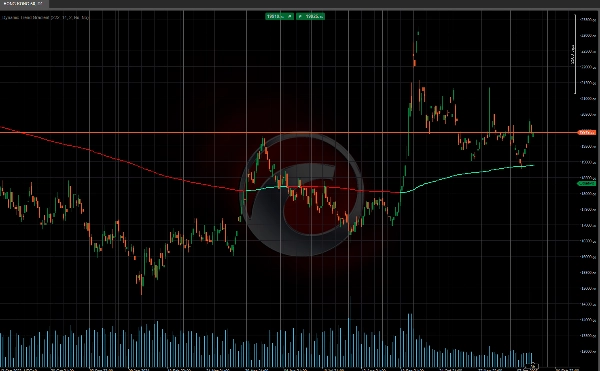
Logótipo de "Dynamic Trend Gradient"
Indicador
1 compras
Versão 1.0, Jan 2025
Windows, Mac
4.0
Avaliações: 2
Imagem carregada de "Dynamic Trend Gradient"
Desde 03/10/2024
153
Vendas
35.86K
Instalações gratuitas

📈 Este indicador é uma ferramenta que nos ajuda a identificar e visualizar a direção da tendência em um gráfico de preços. 📊 Seu funcionamento baseia-se no cálculo dos níveis de tendência usando médias móveis exponenciais e uma medida de volatilidade para determinar as zonas onde o preço deve se mover. A seguir, explicarei em detalhes como funciona:

📐 Cálculo dos Níveis de Tendência

O indicador começa calculando o que é chamado de "nível base". Este nível é obtido pela média de duas médias móveis exponenciais: uma de curto prazo (baseada em um comprimento definido pelo usuário, neste caso, 222) e uma de longo prazo (o dobro do comprimento da primeira). Essas médias nos dão uma referência para a tendência geral.

Em seguida, a volatilidade é calculada usando o desvio padrão dos preços de fechamento, e esse valor é suavizado com uma média móvel exponencial adicional. A volatilidade suavizada é multiplicada por um parâmetro chamado "sensibilidade", que nos fornece os níveis superior e inferior ao redor do nível base. Esses níveis atuam como bandas de tendência e ajudam a identificar se o preço está acima ou abaixo da tendência.

📉📈 Status da Tendência

Com esses níveis calculados, o indicador avalia o status da tendência no mercado. Se o preço estiver acima do nível base, assume uma tendência de alta 🐂, e se estiver abaixo, a tendência é de baixa 🐻. Se o preço cruzar os níveis superior ou inferior, o indicador muda seu sinal de tendência, indicando uma possível reversão ou mudança no momento do mercado.

Esta ferramenta é perfeita para traders que desejam estar à frente das tendências do mercado! 🚀📉📈


Indicadores da Ctrader Store:


Channel Breakout System

Fair Value Gap Sessions

 BOS & CHOCH

ZigZag

Supertrend

Market Imbalance

Adaptive Trend Channel 

Dynamic Market Structure
Analysis of Turning Points

Order Block

Fibonacci Linear
Regression Multi-timeframe

Volume POC Heatmap

Dynamic RSI

Momentum Fair Value Gap

Market Flow Projection

Dynamic Trend Gradient

Multi-Level Candle Bias
Tracker

Zig-Zag Extremity Tracker

Reactive Moving Average

Auto-Trend Channel

Auto Support and
Resistance Trend Lines

All Support and
Resistance Levels

Leverage Liquidation Map

Zones Supply Demand

Dynamic Range Momentum

Perfil do indicador
4.0
Avaliações: 2
5
0 %
4
100 %
3
0 %
2
0 %
1
0 %
Avaliações de clientes
January 27, 2025
It works as a side layer because there is less room for random clicking, and it is not the entire strategy.
January 24, 2025
Signal
Breakout
Supertrend
RSI
Os produtos disponíveis através da cTrader Store, incluindo bots de negociação, indicadores e plugins, são fornecidos por programadores terceiros e são disponibilizados apenas para fins informativos e de acesso técnico. A cTrader Store não é um corretor e não fornece aconselhamento em matéria de investimento, recomendações pessoais ou qualquer garantia de desempenho no futuro.

Mais deste autor

Logótipo de "ZigZag"
Bem avaliado
4.3
(6)
Grátis
Indicador
ATR
RSI
+7
ZigZag filters noise, spots trends, patterns, pivots, aiding analysis, trade management, and confirmations. 📉📈
Indicador
ATR
RSI
+7
Identify bullish and bearish Order Blocks to spot key support/resistance levels and potential trend reversals! 📈🔄
Indicador
ATR
RSI
+7
📊 Shows volume by price levels, highlights POC, and key zones. Identifies dynamic support/resistance and imbalances.
Indicador
ATR
RSI
+6
Market structural patterns , specifically the concepts of Change of Character (ChoCH) 🔄 and Break of Structure (BoS) 💥
Indicador
ATR
RSI
+6
Adaptive trend channel using linear regression and Pearson correlation for dynamic support, resistance, and trends.
Indicador
RSI
Breakout
+1
"Identify key market zones and visualize support/resistance from multiple timeframes on a single chart.
Indicador
ATR
RSI
+7
identify and highlight temporary market inefficiencies known as "fair value gaps" 🚨 within specific trading Sessions.
Indicador
ATR
RSI
+6
💹 Define a price channel 📈 and determine trend direction (bullish 🟢 or bearish 🔴).
Indicador
ATR
RSI
+6
📊Zones Supply & Demand: Identifies key price levels with high volume concentration, marking Supply/Demand Zones & Marke
Indicador
RSI
BTCUSD
+5
Identify market structure effortlessly with swing highs, lows, CHoCH, and BOS levels for smart trading decisions! 📊🔍"
Indicador
ATR
RSI
+8
Detects bullish and bearish divergences
Indicador
Advanced price action tool that combines multiple technical analysis concepts

Também poderá gostar de

Indicador
Prop
VWAP
+5
VWAP is a powerful tool for intraday traders
Indicador
ATR
Prop
+7
Smart momentum tool uses advanced filtering and colour cues for clearer market direction and trading signals.
Indicador
Inside Bar
Save time by lighting a candle to look within yourself in another temporality
Indicador
Signal
Supertrend
Supertrend Scanner – Track trends across assets & timeframes in real-time with alerts. Stay ahead, and trade smarter!
Indicador
ATR
RSI
+3
🚀 Specialized algorithm is designed to confirm entry and exit points with precision 🎯
Indicador
RSI
SMA
+1
TradingView RSI replica for cTrader with dynamic gradients, automatic divergence detection, and alerts.
Indicador
Signal
USDJPY
See USD demand in one line—Composite OBV fuses six major FX pairs into a clear momentum gauge.
Indicador
Market Structure
Support & Resistance
Auto-centers price when it moves beyond threshold. Adjustable zoom. Works on any chart type. Never lose price again.
Indicador
VWAP
Forex
+12
Unlock VWAP in cTrader! Choose anchor periods, price sources, and display deviation bands with real-time tick updates.
Indicador
RSI
Signal
The Wyckoff Toolkit is the ultimate ally for traders seeking to decode the market through the lens of "smart money."
Indicador
SMC
Pro Volume Profile with Delta, Session Filters & CSV Export. Precision order flow analysis.
Indicador
ATR
RSI
+18
Breakout SMA by SLA is a trend-filtering tool designed to enhance the ORB SLA framework.
Indicador
AI-assisted
Predictive Monte Carlo Engine Forecast future price paths using institutional-grade statistical models and probability
Indicador
Prop
Forex
+4
Randomly displays trading quotes for 30s followed by a hidden break. Keeps charts clean while boosting trader mindset.
Indicador
RSI
Forex
+10
Unlock Stochastic RSI PRO in cTrader! Overlay RSI, highlight zones, and identify divergences with customizable settings.
Indicador
EMA
RSI
+5
MACD Colour Histogram with 11 Moving Average Types, Multi-timeframe confirmation and Sound Signal Alert.
Indicador
BOS
CHOCH
+5
Smart Money Concepts Automate your institutional analysis and make decisions with pinpoint precision..
Indicador
Color-Based Market Pressure & Volatility Visualizer The Kandika Heatmap Indicator
Desde 03/10/2024
153
Vendas
35.86K
Instalações gratuitas