
설명
🚀 10,000명 이상의 트레이더가 이미 우리의 TOP 지표🏆
전문가들이 왜 우리를 선택하는지 알아보세요 – 가장 강력한 도구들이 cTrader(지표, 알고리즘, cBots)에서 여러분을 기다리고 있습니다.
👉 모든 TOP 시스템을 여기에서 받으세요:
_______________________________________________
📌 시장 구조 지표
· ✅ AdvancedMarket Structure: Bos, Choch, SwinLevels, Order Blocks, 시장 구조& 유동성 탐색기
· 🔄 동적 시장 구조 전환점 분석
· 🧱 오더 블록
· ⚖️ 시장 불균형
· ⛓️ BOS & CHOCH
· 🧠 ICT 파워 오브 3
· 🌀 시장 극성 구역
_______________________________________________
🔚 스마트 종료 시스템
· 📍 추적 스마트 알고리즘
_______________________________________________
📐 지그재그 지표
· 🔍 지그재그 가격 유동성 투영
· 🧭 S&R 구조적 지그재그
· ➖ 지그재그
· 🎯 지그재그 극한 추적기
_______________________________________________
🧱 지지 및 저항 지표
· 🟩 스마트트렌드 지지 및 저항선
· 🧱 모든 지지 및 저항 레벨
_______________________________________________
📊 추세 및 채널 지표
· 🔄 자동 추세 채널
· 📊 슈퍼트렌드
· ⚡모멘텀 추세 분석기
· 🧠 적응형 추세 채널
· 💥 채널 돌파 시스템
· 🌈 동적 추세 그라디언트
· ⭐ 프리미엄 SSL 채널
· 🔁 반응형 이동평균
_______________________________________________
💧 거래량 및 유동성 도구
· 🔥 거래량 POC 히트맵
· 📉 레버리지 청산 지도
· 🔍 모멘텀 공정 가치 갭
· 🕒 공정 가치 갭 세션
_______________________________________________
⚡ 모멘텀 및 RSI 지표
· 📈 RSI 추세 트리거
· 🚀 동적 범위 모멘텀
_______________________________________________
🔮 예측 및 투영 도구
· 📈 거래량 기반 시장 흐름 투영기
🟢 오더 블록 식별 🔴
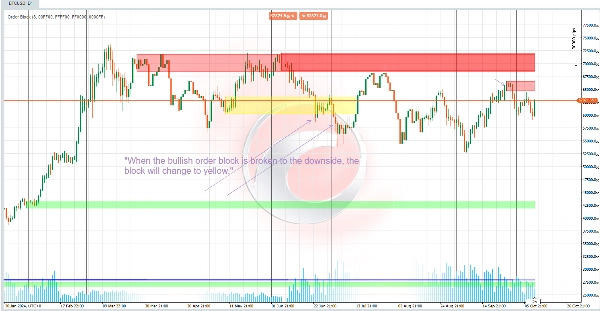
**강세 오더 블록 🚀:**
강세 오더 블록을 찾으려면:
- 현재 종가가 이전 스윙의 최고점을 넘었는지 확인합니다 ⬆️.
- 만약 그렇고 그 스윙이 아직 교차되지 않았다면, 교차된 것으로 표시됩니다. 오더 블록은 이전 캔들에서 최저가부터 최고가까지 정의됩니다 📈.
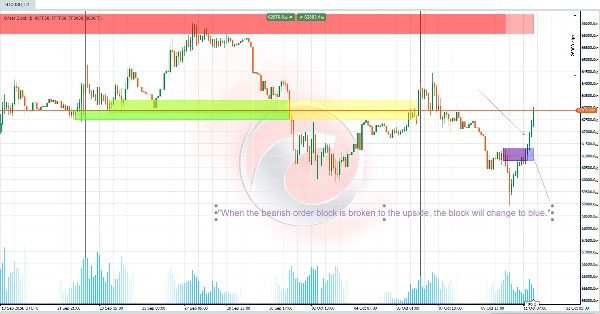
**약세 오더 블록 🔻:**
- 이와 비슷하게 작동하지만 저가 스윙에 적용됩니다.
- 현재 종가가 스윙의 최저점 아래로 떨어지면 약세 오더 블록이 생성됩니다 ⬇️.
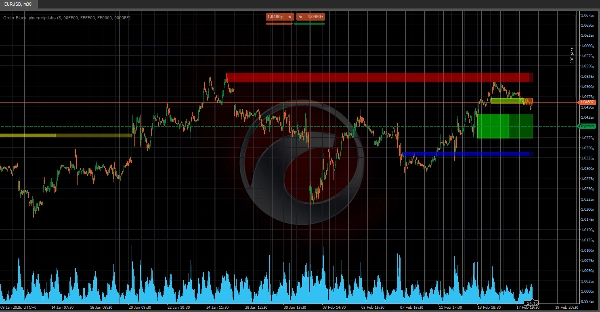
### 💼 오더 블록 기능 📊
오더 블록은 **대량 거래가 이루어진 고거래량 축적 구역**을 나타냅니다
이 구역들은 종종 잠재적인 지지 또는 저항 레벨로 작용하며 추세 지속 또는 반전을 신호할 수 있습니다 📉📈.
- **지지 또는 저항:** 깨진 오더 블록은 이전 추세에 따라 관련 지지 또는 저항 구역을 나타낼 수 있습니다 🔄.
- **지속 또는 반전:**
- 반대 방향으로 오더 블록이 깨지면 잠재적 반전을 나타낼 수 있습니다 🔄.
- 같은 방향으로 깨지면 추세 지속을 확인할 수 있습니다 🔗.
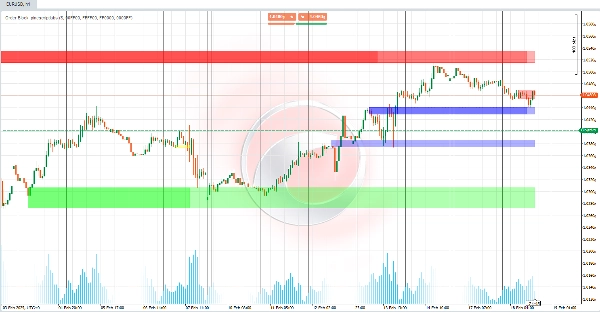
이 지표는 차트에서 **핵심 레벨을 식별하는 데 강력하며** 📈, 트레이더가 고거래량 구역의 가격 행동을 기반으로 중요한 영역을 시각화하는 데 도움을 줍니다. 추세와 시장 움직임을 포착하는 데 완벽합니다! 🎯📊
요약
고객 리뷰
5 | 100 % | |
4 | 0 % | |
3 | 0 % | |
2 | 0 % | |
1 | 0 % |


