
설명
https://chartshots.spotware.com/c/695be69b1a3ca
https://chartshots.spotware.com/c/695be2a98e848
https://chartshots.spotware.com/c/695be7e8e88fa
https://chartshots.spotware.com/c/695be31346fe7
https://chartshots.spotware.com/c/695be3bd18aea
https://chartshots.spotware.com/c/695be5d5687c7
자동 차트 패턴
📊 이것은 무엇인가요?
이 자동 차트 패턴 지표는 다중 타임프레임 스윙 포인트 분석을 사용하여 고전적인 차트 패턴을 자동으로 감지하고 시각화하는 고급 기하학적 형성 스캐너입니다. 스윙 고점과 저점을 추세선으로 연결하여 채널, 쐐기, 삼각형을 포함한 14가지 다양한 기하학적 형성을 식별하여 포괄적인 패턴 인식 시스템을 만듭니다.
🎯 무엇을 위한 것인가요?
이 지표는 트레이더가 다음을 할 수 있도록 도와줍니다:
- 자동으로 14가지 고전 차트 패턴 (채널, 쐐기, 삼각형) 📐를 감지합니다.
- 잠재적 돌파 구역을 식별 합니다 ⚡
- 기하학적 가격 관계를 통해 시장 구조를 시각화 합니다 🔍
- 시각적 확인과 함께 추세 지속 및 반전 패턴을 거래 합니다 ✅
- 패턴을 추세 방향 및 최종 피벗 유형별로 필터링 합니다 🎛️
- 여러 스윙 타임프레임을 동시에 분석 하여 일치점을 찾습니다 🌊
🔍 어떻게 작동하나요?
스윙 포인트 감지 시스템 📍
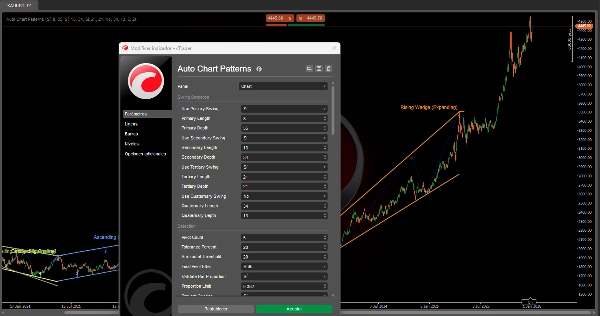
이 지표는 최대 네 개의 독립적인 스윙 감지기 를 동시에 실행하며, 각각 감도 설정이 가능합니다:
- 감지 논리:
-
- 롤링 윈도우(기간) 동안 가격의 최고점과 최저점을 모니터링합니다.
- 지역 최고점(스윙 고점)과 최저점(스윙 저점)을 식별합니다.
- 최소 깊이 요건을 충족한 후에만 스윙을 확인하여 노이즈를 방지합니다.
- 스윙 고점: 가격이 기간 내 최고점을 기록한 후
MinDepth봉 동안 하락합니다. - 스윙 저점: 가격이 기간 내 최저점을 기록한 후
MinDepth봉 동안 상승합니다.
- 네 개의 스윙 레이어:
-
- 기본 스윙 (기본값: 길이 8, 깊이 55) - 장기 구조 🔵
- 보조 스윙 (기본값: 길이 13, 깊이 34) - 중기 구조 🟢
- 3차 스윙 (기본값: 길이 21, 깊이 21) - 단기 구조 🟡
- 4차 스윙 (기본값: 비활성화) - 사용자 지정 타임프레임 🟣
각 감지기는 특정 시장 구조에 집중할 수 있도록 독립적으로 활성화/비활성화할 수 있습니다.
패턴 형성 과정 🎨
1단계 - 피벗 수집:
- 시스템은 활성 감지기에서 가장 최근의 5개 또는 6개의 스윙 포인트 를 수집합니다.
- 포인트는 고점과 저점이 번갈아 나타나야 합니다(지그재그 구조).
- 예: 5포인트 - 고점 → 저점 → 고점 → 저점 → 고점.
2단계 - 추세선 구축:
- 피벗을 상단 포인트(스윙 고점)와 하단 포인트(스윙 저점)로 분리합니다.
- 두 개의 추세선을 그립니다: 상단 경계선과 하단 경계선.
- 3포인트 경계선의 경우: 3가지 조합(0-2, 0-1, 1-2)을 테스트하여 최적 적합도를 선택합니다 ⭐
- 추세선이 캔들 몸통을 관통하지 않는지 확인합니다(심지 부분만 허용).
- 적합도 점수를 계산합니다: 추세선은 피벗 사이 막대의 20% 미만에 닿아야 합니다.
3단계 - 기하학적 분석:
- 상단과 하단 경계선 사이의 각도 관계를 측정합니다.
- 형성이 확장형(넓어짐), 수축형(좁아짐), 또는 평행형(일정 폭)인지 결정합니다.
- 추세 방향을 식별합니다: 상승, 하락, 또는 중립 (수평).
- 기하학적 기준에 따라 14가지 형성 유형 중 하나로 분류합니다.
4단계 - 검증 및 필터링:
- 바 비율 검사: 스윙 간격이 비례적인지 확인하여 왜곡된 패턴을 방지합니다 ✅
- 중복 방지: 기존 패턴과 충돌하는 새 패턴을 차단합니다 🚫
- 중복 검사: 같은 패턴의 재그리기를 방지합니다.
- 최종 피벗 필터: 지정된 피벗 방향(상승/하락/양쪽)으로 끝나는 패턴만 표시합니다.
- 형성 유형 필터: 특정 패턴 범주를 활성화/비활성화합니다.
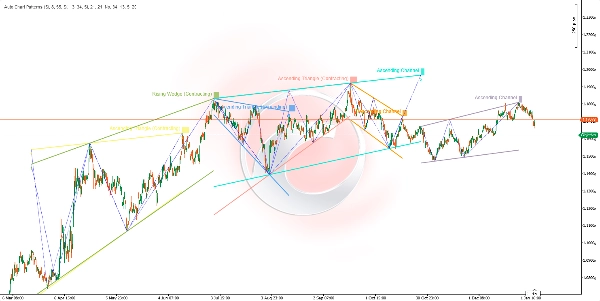
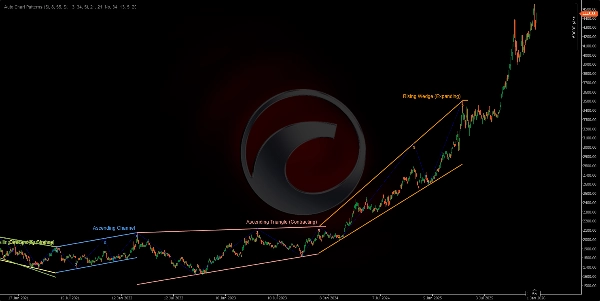
5단계 - 시각화:
- 12가지 색상 팔레트에서 생생한 색상으로 상단 및 하단 경계선을 그립니다 🎨
- 선택적으로 피벗을 연결하는 지그재그 스윙 라인(점선 파란색)을 표시합니다.
- 각 스윙 포인트에 피벗 번호(1, 2, 3, 4, 5)를 표시합니다.
- 최종 피벗에 패턴 이름으로 형성을 라벨링합니다.
- 라벨 뒤 배경을 색상으로 구분하여 명확성을 높입니다.
📐 감지된 14가지 형성
채널 (평행 형성) 📦
- 상승 채널 (상향 평행) 📈
-
- 양쪽 경계선이 비슷한 각도로 상승합니다.
- 강세 지속 추세를 나타냅니다.
- 거래: 하단 경계선에서 매수, 상단 경계선에서 매도.
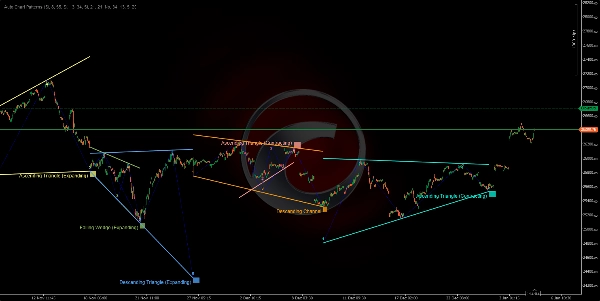
- 하락 채널 (하향 평행) 📉
-
- 양쪽 경계선이 비슷한 각도로 하락합니다.
- 약세 지속 추세를 나타냅니다.
- 거래: 상단 경계선에서 매도, 하단 경계선에서 매수.
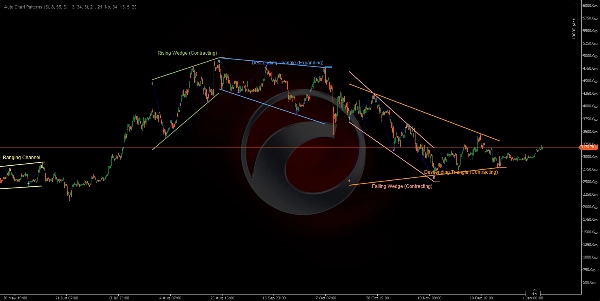
- 횡보 채널 (수평/횡보) ↔️
-
- 양쪽 경계선이 거의 수평입니다.
- 통합 또는 불확실성을 나타냅니다.
- 거래: 범위 내 전략, 지지에서 매수/저항에서 매도.
확장 쐐기 (확대 형성) 📣
4. 상승 쐐기 (확장) ⚠️
* 양쪽 경계선이 상승하며 간격이 넓어집니다.
* 약세 반전 패턴 - 가격이 상승 모멘텀을 잃음.
* 거래: 하단 경계선 돌파 대기 후 숏 진입.
5. 하락 쐐기 (확장) ⚠️
* 양쪽 경계선이 하락하며 간격이 넓어집니다.
* 강세 반전 패턴 - 가격이 하락 모멘텀을 잃음.
* 거래: 상단 경계선 돌파 대기 후 롱 진입.
6. 확장 삼각형 (확대 삼각형) 🔺
* 상단 경계선은 상승, 하단 경계선은 하락합니다.
* 높은 변동성 확대 패턴.
* 거래: 매우 위험하며 명확한 방향 돌파를 기다립니다.
7. 상승 삼각형 (확장) 📊
* 상단 경계선은 수평, 하단 경계선은 상승합니다.
* 확장 범위와 함께 강세 지속 패턴.
* 거래: 상단 경계선 돌파 시 매수.
8. 하락 삼각형 (확장) 📊
* 하단 경계선은 수평, 상단 경계선은 하락합니다.
* 확장 범위와 함께 약세 지속 패턴.
* 거래: 하단 경계선 붕괴 시 매도.
수축 쐐기 (수렴 형성) 🔻
9. 상승 쐐기 (수축) 🔺
* 양쪽 경계선이 상승하며 간격이 좁아집니다.
* 약세 반전 패턴 - 강세 피로 ⚠️
* 거래: 하단 경계선 돌파 시 숏 진입.
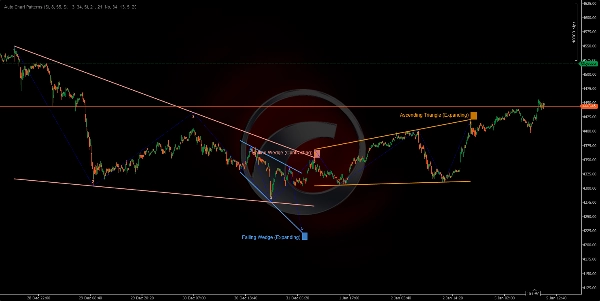
10. 하락 쐐기 (수축) 🔻
* 양쪽 경계선이 하락하며 간격이 좁아집니다.
* 강세 반전 패턴 - 약세 피로 ⚠️
* 거래: 상단 경계선 돌파 시 롱 진입.
수축 삼각형 (통합 형성) △
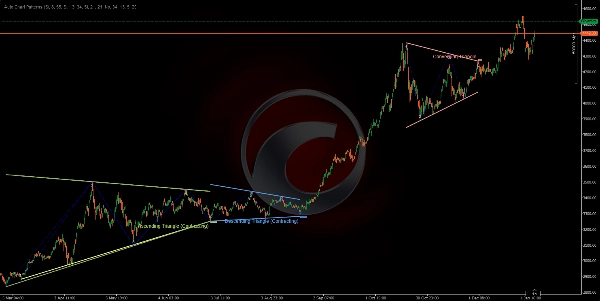
11. 수렴 삼각형 (대칭 삼각형) ⚖️
* 상단 경계선은 하락, 하단 경계선은 비슷한 속도로 상승합니다.
* 중립 통합 - 지속 패턴.
* 거래: 돌파 방향을 기다리고 그에 따라 거래합니다.
12. 하락 삼각형 (수축) 📐
* 하단 경계선은 수평(지지), 상단 경계선은 하락합니다.
* 약세 지속 패턴 🔴
* 거래: 거래량과 함께 지지 붕괴 시 숏 진입.
13. 상승 삼각형 (수축) 📐
* 상단 경계선은 수평(저항), 하단 경계선은 상승합니다.
* 강세 지속 패턴 🟢
* 거래: 거래량과 함께 저항 돌파 시 롱 진입.
14. 무효/알 수 없음 ❌
* 기하학적 기준을 충족하지 않는 패턴.
* 자동으로 필터링됩니다.
요약
Key functionalities include identifying potential breakout zones, visualizing market structure through geometric price relationships, and supporting trading of continuation and reversal patterns with visual confirmation. Users can filter detected patterns by trend direction, pivot type, and formation category. The indicator prevents overlapping and duplicate patterns to maintain clarity.
The 14 detected formations cover a range of classical patterns such as ascending, descending, and ranging channels; expanding and contracting wedges; and various triangle types (converging, diverging, ascending, descending). Visual outputs include color-coded boundary lines, pivot numbering, zigzag swing lines, and labeled pattern names for easy interpretation. This tool supports analysis across multiple markets including Forex, stocks, commodities, indices, and cryptocurrencies.
고객 리뷰
5 | 50 % | |
4 | 50 % | |
3 | 0 % | |
2 | 0 % | |
1 | 0 % |


