
Nebula Range Filter Pro
지표
2 구매
버전 1.0, Sep 2025
Windows, Mac
5.0
리뷰: 1
설명
⚡ Nebula Range Filter Pro 는 트레이더가 시장 소음을 걸러내고 의미 있는 움직임에만 집중할 수 있도록 도와주는 cTrader용 전문 트렌드 필터 지표입니다.
이동 평균 기준선과 적응형 범위 필터를 결합하여 Nebula는 무작위 변동을 무시하면서 명확한 강세 및 약세 단계를 강조합니다.
이로 인해 외환, 지수, 원자재 및 암호화폐 거래를 위한 가장 효과적인 소음 필터 지표 중 하나가 됩니다.
자세한 FAQ와 더 많은 자료는 AlgoXP에서 확인하세요.
📊 작동 원리
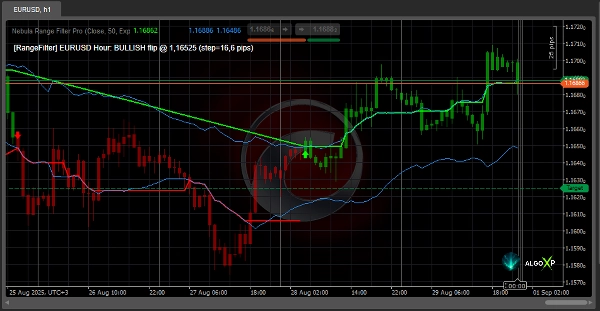
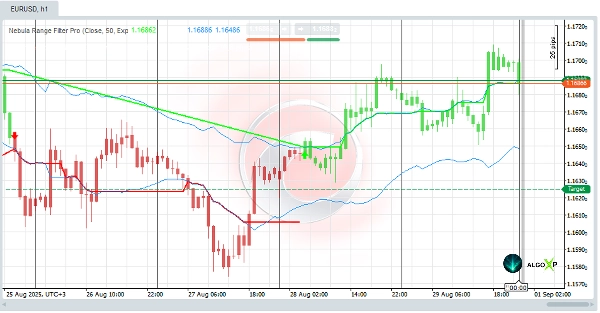
이 지표는 기준 이동 평균선을 생성하고 동적 채널로 둘러쌉니다. 가격이 채널 내에 머무는 한, 추세는 변하지 않습니다.
가격이 채널을 돌파하면 지표는 방향을 전환하고 색상을 변경합니다:
- 녹색 선 = 강세 단계 (롱 바이어스)
- 빨간 선 = 약세 단계 (숏 바이어스)
또한, 추세에 따라 캔들스틱 색상을 지정할 수 있어 차트가 시각적으로 더 깔끔하고 읽기 쉬워집니다.
결과: 신뢰할 수 있는 추세 신호가 있는 명확한 차트와 더 적은 오경보.
✅ 주요 기능
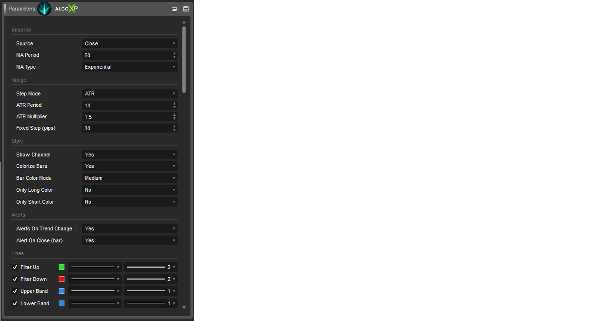
- 이동 평균과 소음 범위를 기반으로 한 추세 필터링.
- 범위 크기 조절을 위한 두 가지 모드:
• ATR × 배수 (변동성에 적응).
• 고정 핍 (일정 크기). - 시각적 신호:
• 녹색 선 = 강세 단계.
• 빨간 선 = 약세 단계. - 기준선 위아래의 선택적 채널 표시.
- 세 가지 스타일(밝음, 중간, 투명)로 추세에 따른 바 색상 지정.
- 강세 바 또는 약세 바만 색칠하는 별도 옵션.
- 전환 시 추세 변화 알림 (바 마감 시 확인 옵션 포함).
- 차트상의 전환 표시기 (전환 지점의 화살표).
🎯 적합 대상
- 소음 없는 깔끔한 차트를 원하는 트레이더.
- 거짓 진입을 필터링하는 단기 시간대(M5–M15)의 스캘퍼.
- 추세 추종 돌파 또는 되돌림 시스템을 사용하는 일중 트레이더.
- 오직 주요 추세 변화만 보고 싶은 스윙 트레이더.
- cBots에서 진입 신호로 지표 전환을 사용하는 알고리즘 트레이더.
⚡ 왜 Pro인가요?
- 컨트롤: 알림과 시각적 표시기가 화면을 계속 바라보지 않고도 전환을 포착하도록 도와줍니다.
- 규율: 모든 틱이 아닌 중요한 전환만 표시합니다.
- 유연성: ATR 모드는 시장 변동성에 적응하며, 고정 모드는 안정적인 필터를 유지합니다.
명확성: 색상 선, 채널 및 바 음영이 추세를 쉽게 읽을 수 있도록 만듭니다.
요약
AI 요약
Nebula Range Filter Pro is a trend filter indicator designed for the cTrader platform, aimed at helping traders identify clear bullish and bearish market phases by filtering out market noise. It combines a baseline moving average with an adaptive range filter to create a dynamic channel around the price. The trend remains stable while price stays within this channel; a breakout signals a trend reversal, indicated by a color change—green for bullish and red for bearish phases. The indicator also offers optional candlestick coloring based on trend direction for enhanced chart clarity.
Key features include two modes for setting the range size—an ATR-based adaptive mode and a fixed pips mode—visual trend signals, optional channel display, customizable bar coloring styles, separate options for coloring bullish or bearish bars, trend change alerts with confirmation options, and flip markers at reversal points.
The indicator supports multiple markets including Forex, indices, commodities, cryptocurrencies, and stocks. It is suitable for scalpers, intraday traders, swing traders, and algorithmic traders who rely on trend signals for entries. Nebula Range Filter Pro aims to provide a clear chart with reliable trend signals and reduced false alerts through its noise filtering approach.
지표 프로필
고객 리뷰
5.0
리뷰: 1
5 | 100 % | |
4 | 0 % | |
3 | 0 % | |
2 | 0 % | |
1 | 0 % |
고객 리뷰
September 18, 2025
solid enough as a backup opinion. A week of notes gives a better read.
상담
자주 묻는 질문(FAQ)
BTCUSD
Forex
Indices
EURUSD
Commodities
GBPUSD
NZDUSD
Prop
Crypto
Stocks
XAUUSD
NAS100
USDJPY
트레이딩 봇, 지표, 플러그인 등 cTrader Store에서 제공되는 상품은 제3자 개발자에 의해 제공되며, 이는 단순히 정보 및 기술적 접근을 목적으로 제공된 것입니다. cTrader Store는 중개인이 아니며, 투자 조언, 개인별 추천 또는 향후 성과에 대한 어떠한 보장도 제공하지 않습니다.


가격
가입일 13/08/2025
450
판매
4.87K
무료 설치