
Mô tả
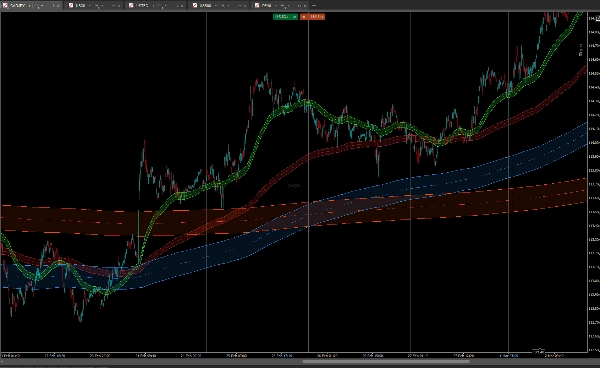
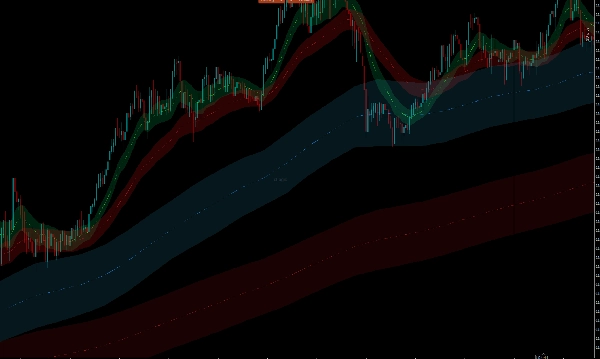
Theo Dõi Xu Hướng là một chỉ báo phủ vẽ hai cặp dải Trung Bình Động trên giá Cao và Thấp — một Dải Nhanh và một Dải Chậm — tạo ra các vùng hỗ trợ và kháng cự động, tự nhiên bao quanh hành động giá.
Hỗ trợ đa khung thời gian cho phép bạn hiển thị các dải từ khung thời gian cao hơn (ví dụ: Hàng ngày, H4) trực tiếp trên biểu đồ hiện tại mà không cần chuyển đổi. Các dải MTF sử dụng màu sắc riêng biệt để cả hai khung thời gian luôn hiển thị rõ ràng ngay lập tức.
Nội suy tuyến tính làm mượt các chuyển đổi giữa các thanh khung thời gian cao hơn, loại bỏ hiệu ứng bậc thang trên các khung thời gian thấp hơn.
Hỗ trợ tất cả 8 loại MA của cTrader — Đơn giản, Lũy thừa, Làm mượt Wilder, Lũy thừa kép, Lũy thừa ba lần, Tam giác, Trọng số theo khối lượng và Trọng số — có thể chọn riêng biệt cho dải TF hiện tại và MTF.
Cách đọc:
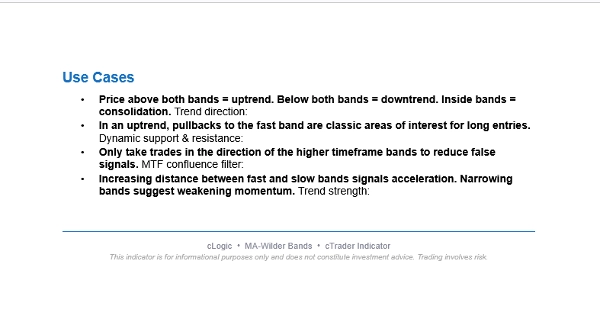
- Giá trên cả hai dải → xu hướng tăng
- Giá dưới cả hai dải → xu hướng giảm
- Giá nằm trong dải → tích lũy
- Khoảng cách tăng giữa dải Nhanh và dải Chậm → tăng tốc xu hướng
Bạn có thể tìm thấy robot cBot này tại đây:
https://ctrader.com/products/3618?u=cLogic


![Logo "[Stellar Strategies] Linear Regression Candles 1.1"](https://cdn.ctrader.com/image/webp/8b9cff9f-2431-46d2-b0ec-c7f55f4a4a6d_27918)


