
(ViPi) MTF Candles
Chỉ báo
105 lượt tải
Phiên bản 1.0, Feb 2026
Windows, Mac
Mô tả
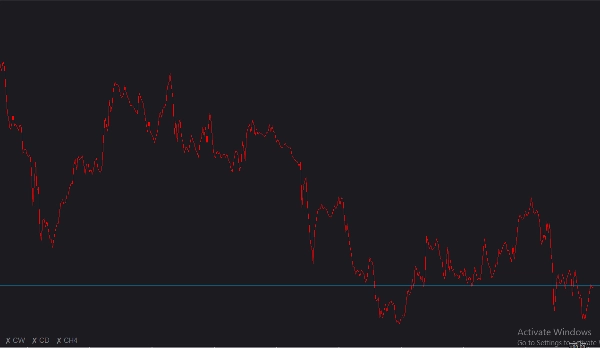
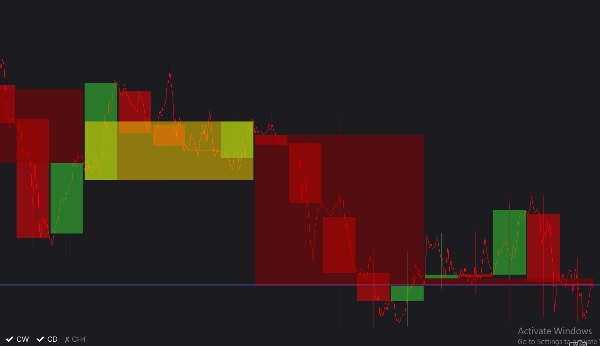
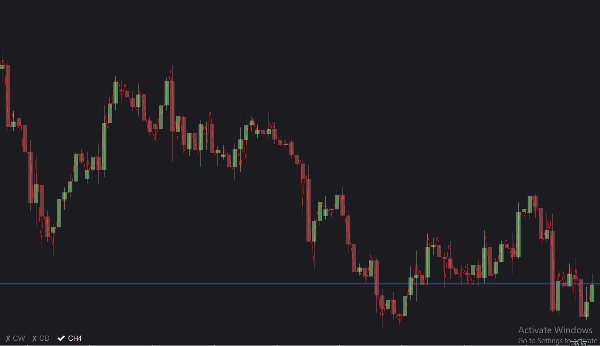
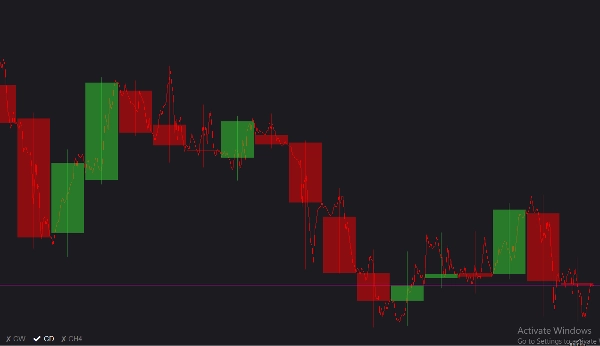
Giới thiệu chi tiết (ViPi) MTF Candles là một công cụ biểu đồ tương tác cao, có thể tùy chỉnh, được thiết kế để cung cấp cho các nhà giao dịch cái nhìn tổng quan từ trên xuống về thị trường mà không cần rời khỏi biểu đồ đang hoạt động của họ. Bằng cách chồng lên tới ba cây nến khung thời gian cao hơn (MTF) khác biệt trực tiếp lên chế độ xem hiện tại của bạn, bạn có thể dễ dàng phát hiện các xu hướng kinh tế vĩ mô, các mức hỗ trợ/kháng cự chính và sự thay đổi thị trường chỉ trong nháy mắt. Nó có một menu chuyển đổi trên biểu đồ gọn gàng, không gây cản trở, cho phép bạn nhanh chóng ẩn hoặc hiện từng khung thời gian, đảm bảo không gian làm việc của bạn luôn sạch sẽ và tập trung.
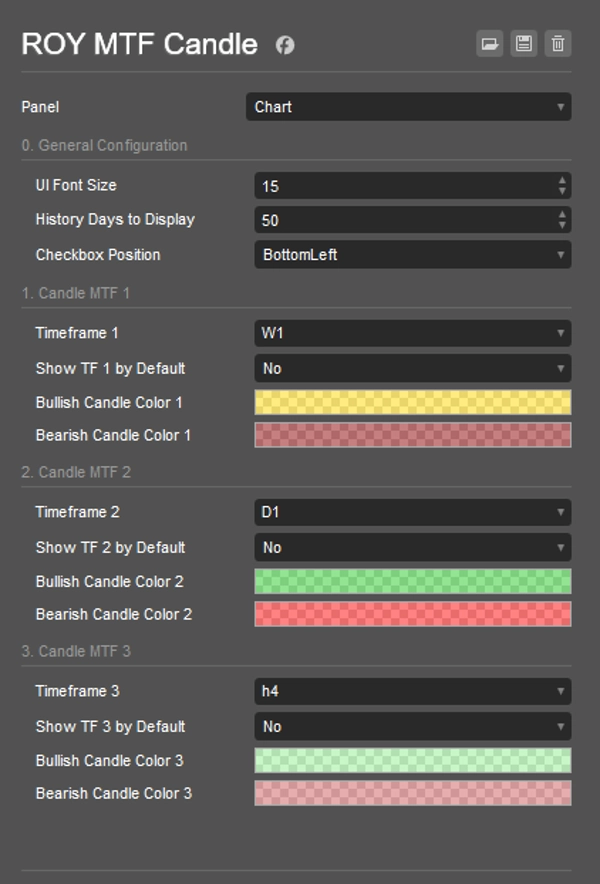
Danh sách tham số đầy đủ
- Kích thước phông chữ giao diện người dùng: Điều chỉnh kích thước chữ cho các nút chuyển đổi tương tác trên biểu đồ. Có thể đặt từ 8 đến 30 (Mặc định: 11).
- Số ngày lịch sử hiển thị: Xác định số ngày trước đó mà chỉ báo sẽ vẽ các cây nến MTF lịch sử (Mặc định: 50 ngày).
- Vị trí hộp kiểm: Cho phép bạn cố định menu chuyển đổi giao diện người dùng ở bất kỳ góc nào của biểu đồ: Trên trái, Trên phải, Dưới trái hoặc Dưới phải (Mặc định: Dưới trái).
- Khung thời gian 1, 2, 3: Các khung thời gian cao hơn cụ thể mà bạn muốn theo dõi. (Mặc định lần lượt là Tuần, Ngày và 4 giờ).
- Hiển thị TF 1, 2, 3 theo mặc định: Chuyển đổi xem các cây nến của từng khung thời gian có hiển thị ngay khi chỉ báo được áp dụng lên biểu đồ hay không (Mặc định: Không).
- Màu nến tăng/giảm: Cho phép tùy chỉnh hoàn toàn màu sắc của các cây nến tăng và giảm cho mỗi trong ba khung thời gian, kèm theo hỗ trợ độ trong suốt để tránh che khuất biểu đồ chính của bạn.
Hướng dẫn sử dụng
- Gắn vào biểu đồ: Tải chỉ báo (ViPi) MTF Candles vào không gian làm việc cTrader đang hoạt động của bạn.
- Cấu hình khung thời gian: Mở cài đặt và chọn tối đa ba khung thời gian vĩ mô (ví dụ: Tuần, Ngày và H4) mà bạn muốn theo dõi cùng với khung thời gian hiện tại của bạn.
- Tùy chỉnh hình ảnh: Điều chỉnh màu sắc và độ trong suốt cho các cây nến tăng và giảm của từng khung thời gian để chúng tương phản tốt với nền của bạn.
- Chuyển đổi hiển thị nhanh: Sử dụng các nút tương tác tiện lợi trên biểu đồ (nằm ở vị trí hộp kiểm bạn đã chọn) để nhanh chóng nhấp và bật/tắt các lớp phủ MTF cụ thể khi bạn thực hiện phân tích.
Tóm tắt
Tóm tắt AI
(ViPi) MTF Candles is a charting indicator for cTrader that overlays up to three higher timeframe (multi-timeframe, MTF) candlestick charts directly onto the current chart. This tool enables traders to analyze broader market trends, key support and resistance levels, and shifts in market sentiment without switching charts. Users can customize the displayed timeframes—commonly Weekly, Daily, and 4-hour—and adjust the number of historical days shown. The indicator includes an on-chart toggle menu, which can be positioned in any corner of the chart, allowing quick visibility control of each timeframe overlay. Visual customization options include adjustable font sizes for toggle buttons and configurable bullish/bearish candle colors with transparency settings to maintain chart clarity. This facilitates a streamlined, interactive top-down market perspective suitable for various markets including Forex, indices, commodities, stocks, and cryptocurrencies.
Hồ sơ chỉ báo
Đánh giá của khách hàng
0.0
Đánh giá: 0
Đánh giá của khách hàng
Sản phẩm này chưa có đánh giá nào. Bạn đã dùng thử chưa? Hãy là người đầu tiên chia sẻ với mọi người!
Thảo luận
Câu hỏi thường gặp
BTCUSD
Forex
Indices
EURUSD
Commodities
GBPUSD
NZDUSD
Crypto
Stocks
XAUUSD
NAS100
USDJPY
Các sản phẩm có sẵn trên cTrader Store, bao gồm bot giao dịch, chỉ báo và plugin, được cung cấp bởi các nhà phát triển bên thứ ba và chỉ nhằm mục đích cung cấp thông tin và tiếp cận kỹ thuật. cTrader Store không phải là nhà môi giới và không cung cấp lời khuyên đầu tư, khuyến nghị cá nhân hay bất kỳ đảm bảo nào về hiệu suất trong tương lai.
Sản phẩm khác của tác giả này


![Logo "[Hamster-Coder] Pivot Points MTF"](https://cdn.ctrader.com/image/webp/4c143e5a-309c-40e3-a578-f04d1e133ffa_31159)


Giá
Kể từ 12/06/2025
1
Lượt bán
335
Cài đặt miễn phí